GLP-1 Adverse Event Reports by Drug, Event Type, and Year
By The RX Index Editorial Team — The RX Index Research Last verified: August 3, 2026 · Dataset version: 1.0 · Source-study data through: September 30, 2025
The quotable finding: “Across four peer-reviewed FAERS studies published in 2025 and 2026, semaglutide report counts ranged from 2,920 to 41,065—a 14.1-fold spread. The studies used different date windows, populations, geography, event scope and eligibility rules, so the totals are not interchangeable and do not represent a 14.1-fold difference in risk.”
FDA's rule for reading every number below: “No individual drug is connected to any individual reaction.”
That is the structural problem underneath every drug-by-event count in this database. One report can list several products and several reactions, but the public adverse-event structure does not connect one named reaction to one named drug. FDA also says the existence of a report does not establish that the product caused the event and that the data by themselves do not describe a product's safety profile.
This page is a verified concordance of published studies using the FDA Adverse Event Reporting System, now presented within FDA's Adverse Event Monitoring System. It is not a new raw-file recomputation. It puts the report counts, study definitions and arithmetic checks in one place so a number never has to travel without the sentence that defines it.
A report is not a case of proven harm. It is a submitted observation. Nothing on this page is an incidence rate, a risk estimate or a comparative safety verdict.
FDA sources: openFDA drug adverse-event documentation and the FDA AEMS Public Dashboard limitations.
GLP-1 adverse event reports by drug, event type, and year: the verified numbers
Answer capsule: Published GLP-1 report totals cannot be treated as one standardized measurement. The four semaglutide studies below span 2,920 to 41,065 reports, while five tirzepatide studies span 28,349 to 92,807; the event-type and annual tables later on this page use narrower, explicitly defined cohorts.
| Study | Data window | What the study counted | Semaglutide reports |
|---|---|---|---|
| Mattingly, Duru & Conti, Health Affairs Scholar (2026) | Jan 2015–Dec 2024 | Primary-suspect reports limited to administration, dosing/prescribing and product-related reaction categories | 2,920 |
| Stone et al., Obesity (2026) | 2012 Q4–2025 Q1 | Five-drug GLP-1 cohort after case deduplication, adverse-event mapping and treatment-timing exclusions | 26,015 |
| Makkena, Cureus (2026) | Jan 2022–Sep 2025 | Female-specific semaglutide and tirzepatide reports | 32,839 |
| Gandhi, Bhatt & Parhizgar, Journal of Clinical Medicine (2025) | Jan 2022–Sep 2025 | U.S. domestic reports; primary suspect; latest case version retained | 41,065 |
Source: The RX Index Research concordance of the original articles: Mattingly et al., Stone et al., Makkena and Gandhi et al.. Counts were checked against the primary article records on August 3, 2026. They are not denominator-compatible.
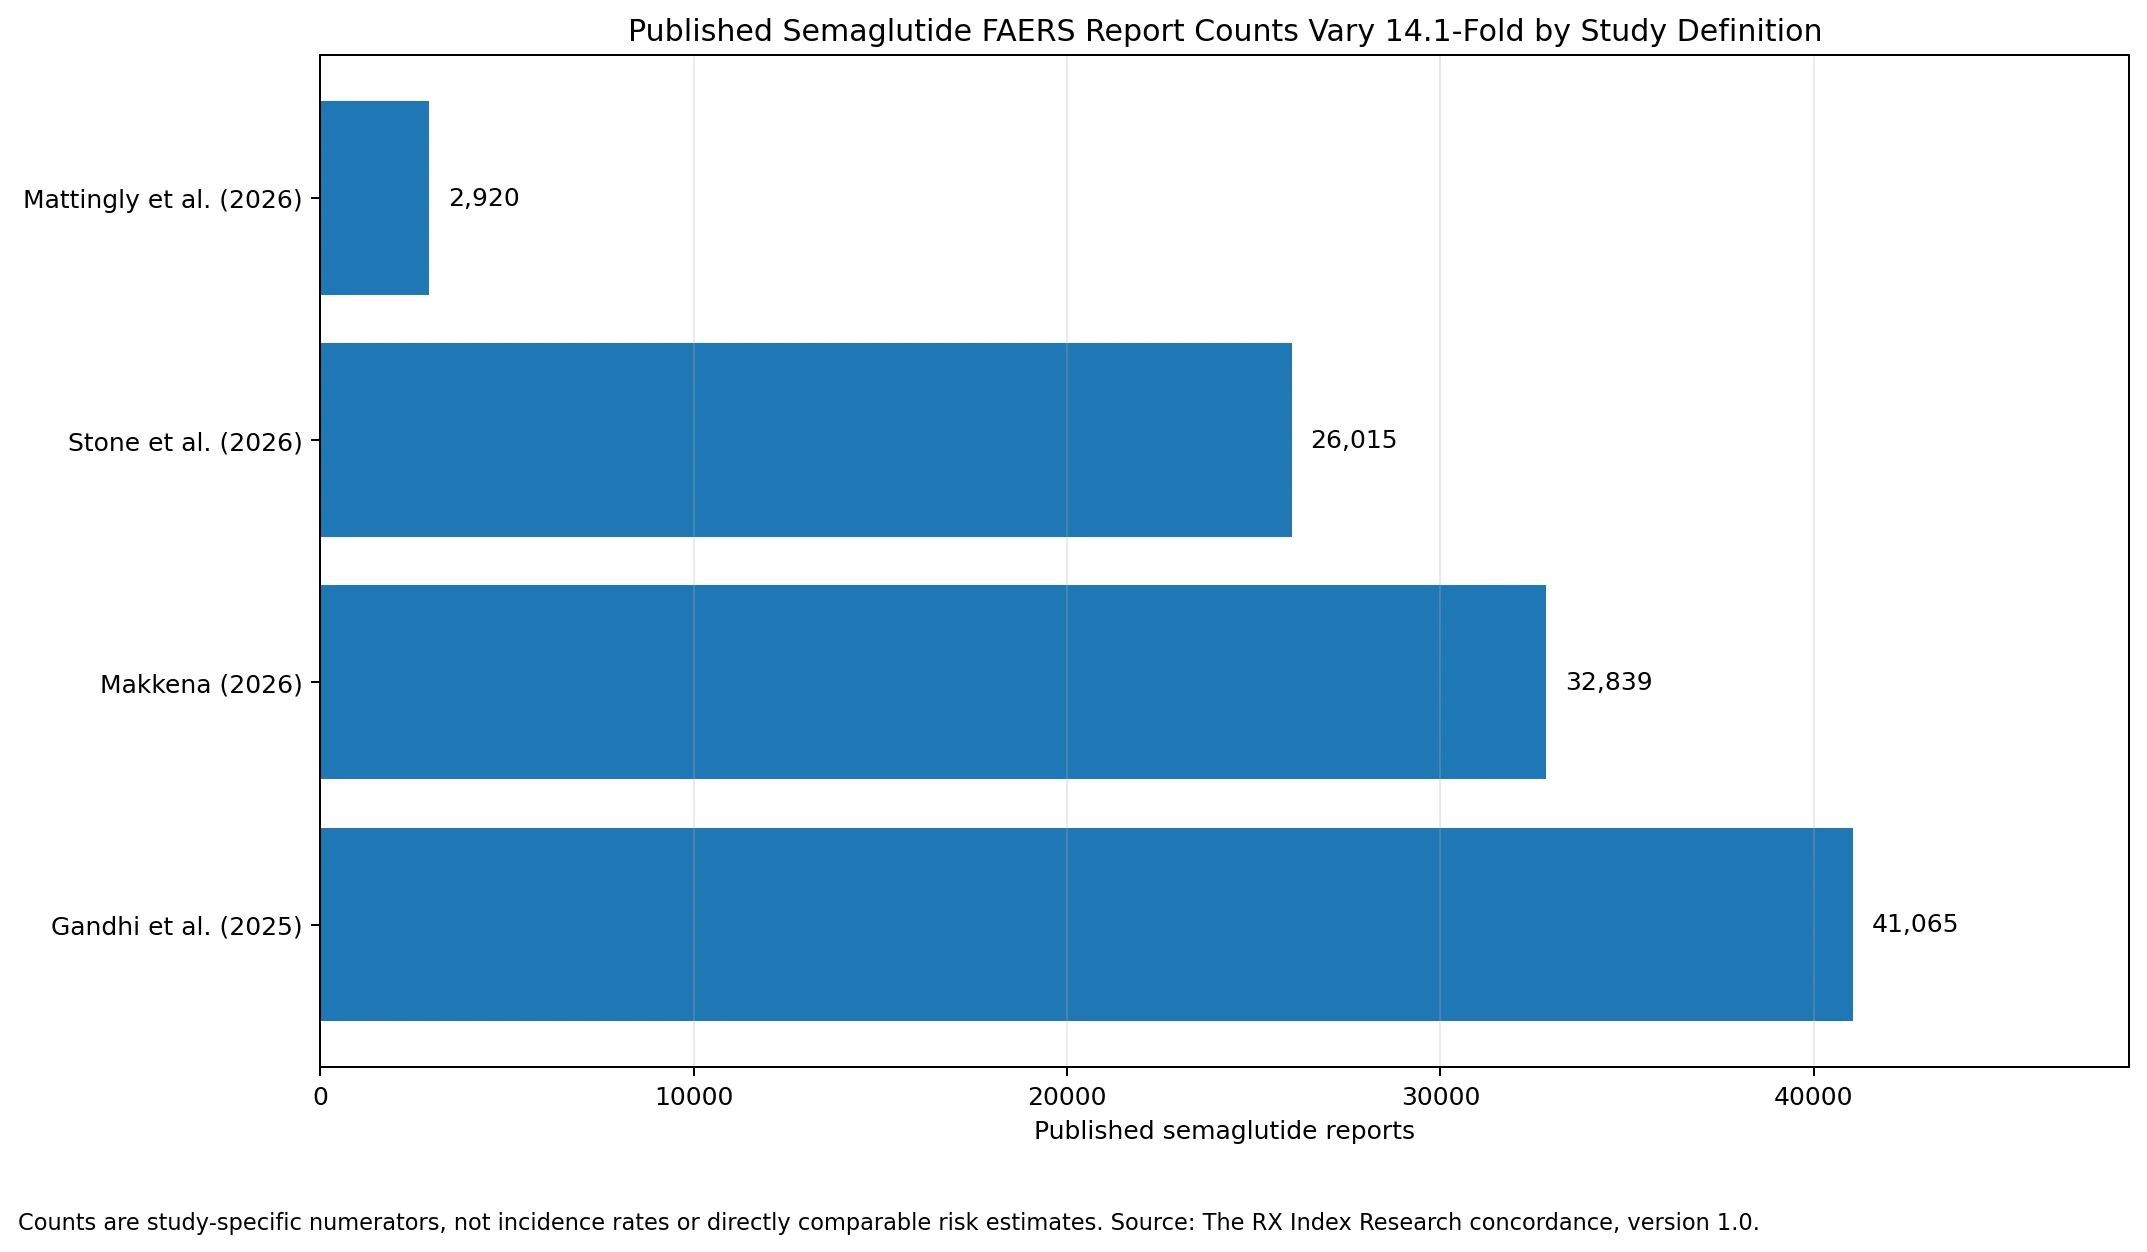
Figure 1. Published semaglutide report counts across four study definitions. Source: The RX Index Research concordance, dataset version 1.0. The bars compare reported numerators, not risk or incidence.
The spread is not a typo:
- 41,065 divided by 2,920 is 14.1.
- Gandhi's 3.75-year window is 30% as long as Stone's 12.5-year window, yet its U.S.-only semaglutide count is 57.9% larger.
- Makkena's female-specific semaglutide count is 26.2% larger than Stone's count, even though Stone did not restrict the cohort by sex and used a window 3.33 times longer.
Those comparisons do not prove that one study is right and another is wrong. They prove that the number is inseparable from its definition.
| Study | Data window | What the study counted | Tirzepatide reports |
|---|---|---|---|
| Mattingly et al. (2026) | Jan 2015–Dec 2024 | Primary-suspect administration, dosing/prescribing and product-related subset | 28,349 |
| Stone et al. (2026) | 2012 Q4–2025 Q1 | Five-drug cohort after the study's deduplication and eligibility rules | 41,017 |
| Almansour et al., Healthcare (2025) | Jan 2022–Mar 2025 | Tirzepatide primary-suspect reports; 96% of reports with country information were from the United States | 65,974 |
| Makkena, Cureus (2026) | Jan 2022–Sep 2025 | Female-specific reports | 70,768 |
| Gandhi et al. (2025) | Jan 2022–Sep 2025 | U.S. domestic reports; primary suspect; latest case version retained | 92,807 |
Source: The RX Index Research concordance of Mattingly et al., Stone et al., Almansour et al., Makkena and Gandhi et al.. Verified August 3, 2026. Counts are study-specific numerators, not comparable rates.
The tirzepatide range is 3.27-fold. The largest total comes from the geographically narrowest study in the table. That is another warning against reading raw report volume as a standardized measurement.
What do these GLP-1 adverse event report statistics show—and what do they not show?
Answer capsule: The statistics show how many reports survived each study's stated rules. They do not show how often an event occurs, whether a named drug caused a named reaction, or which drug is safer.
They show that published numerators move materially when analysts change the date window, sex or geographic population, drug-role rule, event scope, drug-matching rule, case-version rule or final eligibility screen.
They do not show a 14.1-fold difference in semaglutide risk. None of the four semaglutide totals has an exposure denominator, and the four studies did not count the same population or event universe.
They do not show that an individual reaction was attributed to an individual drug in a multi-drug report. FDA's own documentation says that connection is not present in the public adverse-event structure.
They do not show that every report is medically confirmed. FDA describes the reports as potentially incomplete, duplicated or unverified and warns against using them to establish causation or incidence.
Why do published GLP-1 report counts differ so much?
Answer capsule: This concordance normalizes six choices that change the numerator: the observation window, the population and geography, the drug match and role rule, case-version handling, event scope and eligibility, and the counting unit. A count without those fields attached is incomplete.
| Study | Window | Population / geography | Drug-role rule | Case-version handling | Event scope / eligibility | Count unit |
|---|---|---|---|---|---|---|
| Mattingly et al. | 2015–2024 | Not sex-restricted; geography not restricted in the published cohort definition | Primary suspect | Study-specific processing | Administration, dosing/prescribing and product-related reactions only; combination products excluded | Reports |
| Stone et al. | 2012 Q4–2025 Q1 | Not sex-restricted | Study-specific drug mapping | Deduplicated | Mappable adverse-event cases; event had to follow treatment | Cases/reports |
| Gandhi et al. | 2022–2025 Q3 | U.S. domestic only | Primary suspect | Most recent case version retained; invalid case IDs excluded | Semaglutide or tirzepatide reports in the study cohort | Reports |
| Makkena | 2022–2025 Q3 | Female-specific | Study-defined FAERS drug cohort | Study-specific processing | Semaglutide or tirzepatide reports used for the gynecological comparison | Reports |
| Almansour et al. | 2022–2025 Q1 | International dataset; 96% U.S. among reports with country information | Primary suspect | Study-specific processing | Tirzepatide cohort | Reports |
Source: Original methods and results in the five cited articles. The RX Index Research normalized the descriptions into common fields; it did not force the studies into one common denominator. Verified August 3, 2026.
1. The observation windows are different
Tirzepatide was not approved until 2022, so a study starting in 2012 does not automatically give tirzepatide ten extra years of reports. It does, however, change the available history for older ingredients and the quarters included near the cutoff. A three-quarter extension during rapid adoption can add a large number of reports.
2. The populations are different
Makkena restricted the cohort to female-specific reports. Gandhi restricted the cohort to U.S. domestic reports. Almansour did not limit the dataset to the United States, although 96% of reports with country information were U.S. reports. Those are different populations before any event filtering begins.
3. Drug matching and role rules are different
FAERS drug records include product names, active ingredients and a role code such as primary suspect, secondary suspect or concomitant. A primary-suspect analysis is not the same as an any-role search. A brand-name list is not automatically the same as an ingredient-normalized list, especially when combination products are included or excluded.
4. Follow-up versions can change the case count
FAERS is case-and-version based. Gandhi explicitly retained the latest case version and excluded invalid case identifiers. The neurological study described a two-step deduplication rule: retain the latest FDA receipt date for each case identifier, then keep the higher primary identifier when the case and receipt date matched. A study that does not apply the same rule can land on a different numerator.
5. Event scope and final eligibility rules can remove large blocks of records
Mattingly selected administration, dosing/prescribing and product-related reactions and excluded expected pharmacologic adverse events from that cohort. Stone began with 175,821 deduplicated GLP-1 cases, then excluded 33,477 that could not be mapped to an adverse-event category and 4,893 in which the event preceded GLP-1 treatment.
The arithmetic matters:
- 33,477 / 175,821 = 19.0% excluded on mappability grounds.
- (33,477 + 4,893) / 175,821 = 21.8% excluded across both pre-analysis screens.
Mappability alone accounted for 19.0% of the deduplicated cohort; 21.8% is the combined exclusion share.
6. Reports, cases, adverse events and drug-event pairs are not interchangeable
One report can contain several reaction terms. A table of reaction-term counts therefore cannot be summed into a report total without counting the same report more than once. A study reporting 287,201 adverse events is not reporting 287,201 unique patients or 287,201 unique reports.
How do GLP-1 adverse event reports differ by drug?
Answer capsule: The ordering of drugs changes with the cohort definition. Stone's broad five-drug analyzed cohort placed semaglutide third at 26,015 reports, while Mattingly's administration/dosing/product subset placed it fourth at 2,920; the difference cannot be assigned to one method choice alone because the studies also used different windows and eligibility rules.
| Order within study | Stone et al.: analyzed five-drug cohort | Mattingly et al.: administration/dosing/product subset |
|---|---|---|
| 1 | Tirzepatide — 41,017 (29.8%) | Tirzepatide — 28,349 (40.0%) |
| 2 | Dulaglutide — 37,252 (27.1%) | Dulaglutide — 22,859 (32.2%) |
| 3 | Semaglutide — 26,015 (18.9%) | Exenatide — 15,551 (21.9%) |
| 4 | Exenatide — 17,902 (13.0%) | Semaglutide — 2,920 (4.12%) |
| 5 | Liraglutide — 15,265 (11.1%) | Liraglutide — 1,276 (1.80%) |
Source: Published ingredient tables in Stone et al. and Mattingly et al.. Stone's 15,265 liraglutide count is published in the article; it is not a residual estimate. Percentages may not total exactly 100% because of rounding.
Mattingly explicitly excluded combination products, including semaglutide/cyanocobalamin and semaglutide plus vitamin B12. The paper does not quantify how much that exclusion changed semaglutide's count, so this page does not assign the 4.12% share to that rule alone. The correct conclusion is narrower: the five-drug ordering changed after a different event scope, window and eligibility framework was applied.
Which GLP-1 adverse event types were reported most often?
Answer capsule: There is no single all-purpose “top events” table because event scope changes the answer. Mattingly counted three administration/dosing/product categories; Chen et al. counted neurological MedDRA Preferred Terms and identified 19 ROR-positive signals.
| Reaction category selected by the study | GLP-1 reports | Share of the 70,955-report GLP-1 cohort | Insulin reports | Share of the 41,577-report insulin cohort |
|---|---|---|---|---|
| Administration-related | 44,676 | 63.0% | 16,084 | 38.7% |
| Dosing or prescribing | 14,960 | 21.1% | 12,308 | 29.6% |
| Product-related | 11,319 | 16.0% | 13,185 | 31.7% |
| Total | 70,955 | 100.0% | 41,577 | 100.0% |
Source: Mattingly, Duru & Conti, Health Affairs Scholar (2026). These categories were selected before analysis; the table does not mean 63% of all GLP-1 adverse-event reports are administration problems. Verified August 3, 2026.
In this defined cohort, 88.2% of GLP-1 reports were submitted by consumers and 5.2% by health care professionals. “Consumer-reported” is the source category; it should not be silently rewritten as “patient-verified” or “clinician-confirmed.”
The indication field was diabetes for 41.4%, weight loss for 4.8%, and other or unknown for 53.8%. Product type was missing in more than 85% of reports, so this cohort could not support reliable product-type comparisons.
| MedDRA Preferred Term | Reports |
|---|---|
| Dizziness | 7,078 |
| Tremor | 2,519 |
| Dysgeusia | 1,469 |
| Lethargy | 783 |
| Taste disorder | 482 |
| Presyncope | 370 |
| Allodynia | 192 |
| Parosmia | 192 |
Source: Chen et al., Scientific Reports (2025), FAERS data from 2005 Q2 through 2024 Q3. The study analyzed primary-suspect reports and identified 28,953 neurological reports among 250,014 GLP-1-associated adverse-event reports. The terms above are frequently reported members of the study's 19 ROR-positive signals; they are not incidence rates and should not be summed into a unique-report total.
One detail prevents a common misquote: headache was the most frequently reported neurological term overall at 7,132 reports, but it did not meet the study's ROR-positive signal definition. “Most reported” and “disproportionately reported” are different claims.
The neurological study's drug-specific report counts were exenatide 10,175; dulaglutide 6,034; semaglutide 5,935; liraglutide 3,686; tirzepatide 2,867; and lixisenatide 256. Those counts describe the study's neurological cohort, not each drug's full FAERS total.
How did GLP-1 adverse event reports change by year?
Answer capsule: The only complete annual series reproduced here is Mattingly's deliberately narrow administration/dosing/product cohort. It rose from 1,997 GLP-1 reports in 2015 to 18,866 in 2024—a 9.45-fold increase—while the comparison insulin series fell 29.3%.
| Year | GLP-1 reports | Insulin reports | GLP-1 : insulin ratio |
|---|---|---|---|
| 2015 | 1,997 | 5,941 | 0.34 |
| 2016 | 2,000 | 1,767 | 1.13 |
| 2017 | 3,310 | 2,252 | 1.47 |
| 2018 | 4,296 | 4,529 | 0.95 |
| 2019 | 4,760 | 4,068 | 1.17 |
| 2020 | 5,840 | 3,883 | 1.50 |
| 2021 | 6,161 | 4,763 | 1.29 |
| 2022 | 8,409 | 5,219 | 1.61 |
| 2023 | 15,313 | 4,949 | 3.09 |
| 2024 | 18,866 | 4,202 | 4.49 |
Source: Mattingly, Duru & Conti (2026). The ratio column was calculated by The RX Index Research. This is the study's primary-suspect administration/dosing/product subset, not an all-event class total.
The arithmetic produces four clean findings:
- GLP-1 reports in this cohort rose 9.45-fold from 2015 to 2024.
- The largest year-over-year increase was 82.1%, from 8,409 in 2022 to 15,313 in 2023.
- Insulin reports fell 29.3% from 5,941 in 2015 to 4,202 in 2024.
- The GLP-1-to-insulin ratio moved from 0.34 in 2015 to 4.49 in 2024.
Two source-table checks that matter
The annual GLP-1 rows sum to 70,952, three below the stated cohort total of 70,955. The insulin rows sum to 41,573, four below the stated total of 41,577. The article does not explain those small gaps, so this page records them without inventing a reason.
The same source table prints 14,590 (5.1%) for insulin reports with an other-or-unknown indication. The count is internally consistent, but 14,590 divided by 41,577 is 35.1%, not 5.1%. The downloadable source-audit file preserves both the printed value and the arithmetic correction.
How big was the five-drug GLP-1 footprint in Stone's FAERS study?
Answer capsule: Stone et al. screened 18,499,609 FAERS records/cases for 2012 Q4 through 2025 Q1, identified 175,821 deduplicated cases naming one of five GLP-1 medicines, and analyzed 137,451 after two stated exclusions. The 175,821 and 137,451 figures answer different questions and should never be swapped without the cohort step attached.
| Cohort step | Reports/cases |
|---|---|
| FAERS records/cases screened, as reported by the authors | 18,499,609 |
| Deduplicated cases naming one of five GLP-1 medicines | 175,821 (0.95% of screened records/cases) |
| Excluded: not mappable to an adverse-event category | −33,477 |
| Excluded: event occurred before GLP-1 treatment | −4,893 |
| Final analyzed cohort | 137,451 |
Source: Stone et al., Obesity (2026). The RX Index Research reproduced the subtraction and exclusion percentages. Verified August 3, 2026.
The exclusion percentages are:
- Mappability exclusion alone: 19.0% of 175,821.
- Both exclusions combined: 21.8% of 175,821.
Did the March 2026 AEMS launch break the historical year series?
Answer capsule: No permanent break was created in the raw quarterly report dates. FDA launched the AEMS public dashboard on March 11, 2026 and moved toward real-time display, but it continues to publish noncumulative quarterly ASCII extracts; live dashboard snapshots and quarterly research extracts simply require different cutoff documentation.
FDA said the AEMS rollout would consolidate adverse-event reporting across product categories and display reports in real time as centers migrated. That changed the public interface and update cadence. It did not make all pre- and post-March human-drug report dates inherently incomparable.
The practical rule is simple:
- A live dashboard number needs a retrieval date and saved query definition.
- A quarterly-extract analysis needs the included quarters, source-file versions and case-version method.
- A year labeled 2026 is partial unless the full year is present.
This release does not publish a new 2026 raw count. Its latest included source-study cutoff is September 30, 2025. FDA's official quarterly archive remains the right starting point for a future raw-file edition.
FDA sources: AEMS launch announcement, March 11, 2026 and AEMS quarterly data extract files.
Methodology: how this concordance was produced
Answer capsule: The RX Index Research extracted published numerators and the definitions required to interpret them, normalized those definitions into common fields, and reproduced every derived percentage and ratio with explicit arithmetic. No raw AEMS/FAERS report cube was claimed or inferred for this release.
Source universe
This release uses six peer-reviewed pharmacovigilance studies plus FDA documentation:
- Mattingly, Duru & Conti for the 2015–2024 administration/dosing/product cohort and annual series.
- Stone et al. for the five-drug cohort flow and ingredient distribution.
- Gandhi, Bhatt & Parhizgar for the U.S.-domestic semaglutide/tirzepatide cohort.
- Makkena for the female-specific semaglutide/tirzepatide cohort.
- Almansour et al. for the tirzepatide primary-suspect cohort.
- Chen et al. for neurological report counts and Preferred Terms.
- FDA documentation for database structure, interpretation limits, the AEMS transition and quarterly data availability.
Fields extracted from each study
For every headline count, the concordance records the study, publication date, DOI, start and end dates, ingredient, numerator, population restriction, geography, drug-role rule when stated, case-version handling when stated, event scope, counting unit and a plain-language definition.
Derived calculations
The RX Index Research calculated only transparent arithmetic from published inputs:
- Fold spread = largest published count ÷ smallest published count.
- Percent difference = (larger count − smaller count) ÷ smaller count.
- Window ratio = longer study duration ÷ shorter study duration, using calendar quarters.
- Annual change = (later year − earlier year) ÷ earlier year.
- Category share = category count ÷ stated study total.
No missing drug count was estimated as a residual. No study total was converted into a rate. No causal conclusion was generated from a reporting odds ratio.
Verification and versioning
Every published number in this edition was checked against the original article or its primary full-text record and re-calculated where the page labels a result as derived. The files are versioned as 1.0 and were last verified August 3, 2026. A future raw-file edition must be labeled as a different dataset rather than silently replacing this published-study concordance.
Limitations
Answer capsule: The page makes incompatible study counts comparable only at the level of definition, not denominator. It cannot convert spontaneous reports into risk, repair missing exposure data or determine which drug caused which reaction inside a multi-drug report.
- These are report counts, not incidence rates. The studies do not provide the number of exposed people needed for a rate.
- A report does not establish causation. FDA says so directly.
- The studies counted different objects. Some restricted sex or geography; some restricted event categories; some used only primary-suspect drugs; some applied different eligibility screens.
- One report can contain several drugs and several reactions. Event rows should not be summed into a unique-report total.
- Case-version handling is study-specific. A global statement that every study removed duplicates in exactly the same way would be false.
- Reporting is incomplete and selective. Publicity, time on market, utilization, mandatory manufacturer reporting and voluntary consumer or clinician reporting all affect volume.
- Product type is often missing. Mattingly reported more than 85% missingness in its cohort, which prevents reliable class-wide product-type comparisons.
- The annual series is a selected event cohort. The 2015–2024 table is not an all-event class total.
- This release stops at the latest source-study cutoff. It does not claim a new 2026 raw-file count.
This page is educational reference material, not medical advice. It cannot determine whether a medicine is appropriate or safe for one person. Treatment decisions belong with a qualified clinician who knows the patient's history. Suspected problems can be reported through FDA MedWatch.
Frequently asked questions
Which semaglutide adverse-event report number is correct?
All four headline numbers are correct within their study definitions: 2,920, 26,015, 32,839 and 41,065. None is a universal lifetime total. Quote the number with its date window, population, geography, drug-role rule and event scope.
What is the single cleanest number to quote from this page?
The cleanest page-level finding is the 14.1-fold published-count spread for semaglutide: 2,920 to 41,065 across four peer-reviewed studies published in 2025 and 2026. The sentence must retain the fact that the studies used different definitions and that the spread is not a risk comparison.
Does a higher report count mean a GLP-1 drug is more dangerous?
No. A higher count can reflect more use, a later cutoff, a broader event scope, a different population, different drug matching, publicity or different case-handling rules. Raw report counts do not establish which drug is safer.
Are these adverse-event rates?
No. A rate needs an exposure denominator. These studies report numerators from a spontaneous-reporting database and cannot show how often an event occurs among people taking the drug.
Can one FDA report contain more than one drug or event?
Yes. FDA says a report may list several drug products and several patient reactions, and that no individual drug is connected to any individual reaction in the public structure. That is why event rows cannot be added together as though each row were a different person.
Were duplicate and follow-up reports removed?
It depends on the study. Gandhi retained the most recent case version; Chen et al. used a two-step CASEID, FDA receipt date and primary-identifier rule; Stone reported a deduplicated cohort. This concordance records each study's method instead of claiming one shared deduplication rule.
Is AEMS the same as FAERS?
AEMS is FDA's newer, broader adverse-event platform. The human drug adverse-event records analyzed by the studies on this page were published under the FAERS name, and FDA now presents that program within AEMS. “AEMS/FAERS” is useful when referring to the continuity of human-drug data, but AEMS also spans product categories beyond the older drug-only interface.
Are compounded semaglutide and tirzepatide reports included?
The answer is study-specific. Mattingly excluded combination products such as semaglutide/cyanocobalamin and semaglutide plus vitamin B12. Makkena's search terms included compounded formulations. At the same time, product-type data were missing in more than 85% of Mattingly's cohort, so the database could not support a reliable class-wide compounded-versus-approved comparison.
Is 2026 included in these report counts?
No new 2026 raw-file count is published here. The latest source-study cutoff in the concordance is September 30, 2025. FDA has 2026 quarterly files, but those files were not recomputed for this release.
Data files
The data files below reproduce the visible tables and keep the study definitions attached to every number.
- Published GLP-1 FAERS report-count concordance, version 1.0 (CSV)
- Study-definition matrix, version 1.0 (CSV)
- Mattingly annual series, 2015–2024 (CSV)
- Mattingly event-category table (CSV)
- Neurological ROR-positive event terms (CSV)
- Source-audit findings and arithmetic checks (CSV)
Primary sources
FDA documentation
- openFDA drug adverse-event overview
- FDA AEMS Public Dashboard and interpretation limits
- FDA AEMS launch announcement, March 11, 2026
- FDA AEMS quarterly data extract files
- FDA MedWatch
Peer-reviewed studies
- Mattingly TJ II, Duru EE, Conti RM. “Adverse events administering glucagon-like peptide-1 receptor agonists: a cross-sectional study.” Health Affairs Scholar. 2026;4(2):qxag023.
- Stone D, et al. “Evaluating the Evolving Real-World Adverse Events of GLP-1RAs Using FDA Adverse Event Reporting System (FAERS).” Obesity. 2026.
- Gandhi A, Bhatt N, Parhizgar A. “Comparative Renal Safety of Tirzepatide and Semaglutide: An FDA Adverse Event Reporting System (FAERS)—Disproportionality Study.” Journal of Clinical Medicine. 2025;14(21):7678.
- Almansour HA, Thaibah HA, Alfarhan M, Al-Qahtani SA, Khardali AA, Alshammari TM. “Real-World Safety Concerns of Tirzepatide: A Retrospective Analysis of FAERS Data (2022–2025).” Healthcare. 2025;13(18):2259.
- Makkena HB. “Comparative Gynecological Safety of the Dual GIP/GLP-1 Receptor Agonist Tirzepatide vs. the GLP-1 Receptor Agonist Semaglutide: A Real-World Pharmacovigilance Analysis (2022–2025).” Cureus. 2026;18(1):e101738.
- Chen H, Liu S, Gao S, et al. “Pharmacovigilance analysis of neurological adverse events associated with GLP-1 receptor agonists based on the FDA Adverse Event Reporting System.” Scientific Reports. 2025;15:18063.
Related research from The RX Index
- GLP-1 Clinical Trial Demographics: 17 Trials, 21,063 Adults
- GLP-1 Lean Mass Loss by Drug: 2026 Trial Data
- GLP-1 Clinical Trial Exclusion Criteria: 17 Pivotal Trials Compared
- GLP-1 Medicaid Coverage by State: 2026 Data
- GLP-1 Patent Expiration Dates: 2026
Citation details
The reference below identifies the publication, page, dataset edition and verification date so this version can be distinguished from later updates.
The RX Index Editorial Team. “GLP-1 Adverse Event Reports by Drug, Event Type, and Year.” The RX Index Research, dataset version 1.0. Last verified August 3, 2026. https://therxindex.com/research/glp-1-adverse-event-reports-by-drug-event-type-year/
When a specific study count is used, its study definition and original article remain part of the source record.
About this research
The RX Index Research is an independent research and reference resource for primary-sourced prescription-medication data.
Who created this page: The RX Index Editorial Team. How it was produced: The team extracted report counts and method definitions from the primary journal articles, normalized the definitions into one concordance, reproduced the arithmetic and recorded source-table discrepancies without filling gaps by assumption. Why it exists: To stop unlike AEMS/FAERS numbers from being quoted as though they measured the same thing.
This page is not clinician-reviewed and does not claim medical authority beyond the primary sources it cites. It contains no advertising, affiliate links, provider placements, lead forms or product recommendations.
How to cite this page
The RX Index Editorial Team. “GLP-1 Adverse Event Reports by Drug, Event Type, and Year.” The RX Index Research, dataset version 1.0.
Last verified: August 3, 2026.
https://therxindex.com/research/glp-1-adverse-event-reports-by-drug-event-type-year/