GLP-1 Usage by State: 2025 Medicaid Rates Vary 9.3-Fold
 By Kaden Coziar, Founder & Managing Editor · The RX Index Research
Updated September 2026
2025 Medicaid GLP-1 prescription rates ranged from 304.0 per 1,000 average monthly enrollees in Pennsylvania to 32.6 in Arkansas—a 9.3-fold gap, according to The RX Index’s September 2026 analysis of CMS data. These count reported prescriptions, including refills, not people. Compare GLP-1 usage by state below, with Medicare data, surveys and a check of the “22% of Kentuckians” claim.
Key GLP-1 usage by state statistics
- Medicaid GLP-1 prescriptions per 1,000 average monthly enrollees ranged 9.3-fold across states in 2025, from 304.0 in Pennsylvania to 32.6 in Arkansas, according to The RX Index’s analysis of reported CMS prescriptions and enrollment.
- Medicaid reported 11.26 million GLP-1 prescriptions in 2025, up 35% from 8.35 million in 2024, according to The RX Index’s analysis of CMS State Drug Utilization Data.
- Medicare’s GLP-1 users filled at least 5.2 prescriptions per person on average in 2024: 21.8 million claims for no more than 4.17 million distinct users of the included products, according to The RX Index’s analysis of CMS Part D data.
- The RX Index reproduced 22.0 prescriptions per 100 Kentucky residents and 24.2 per 100 West Virginia residents by dividing the 2024 counts printed by GLP-1 Newsroom by Census population. This checks the publisher’s arithmetic; it does not verify its raw claims or measure people using GLP-1s.
- West Virginia is the only state in the top 10 on all three lists compared here: reported Medicaid prescriptions per enrollee (2025), Medicare GLP-1 share of Part D claims (2024), and the publisher-map calculation (2024), according to The RX Index’s source-labeled comparison. This is not a ranking of population use.
- Medicaid GLP-1 prescriptions rose in 43 of 51 jurisdictions (the 50 states and DC) from 2024 to 2025; Missouri (+120.6%) and North Carolina (+115.0%) grew fastest, according to The RX Index’s analysis of reported CMS data.
- North Carolina’s reported Medicaid GLP-1 prescriptions fell 50.6% from the third to the fourth quarter of 2025, the quarter its obesity-only coverage was paused, according to The RX Index’s analysis of CMS counts and the state notice. This timing does not prove cause.
- Among eligible adults without type 2 diabetes in an Epic Cosmos study, the state share with a semaglutide or tirzepatide order ranged from 2.82% to 9.79% during July 2021–October 2025 (American Journal of Preventive Cardiology, 2026). Orders are not confirmed use.
- 4.0% of commercially insured adult patients were prescribed a GLP-1 in 2024, up from 0.9% in 2019 (FAIR Health).
- 12% of U.S. adults said they were currently taking a GLP-1 for any reason in late 2025 (KFF Health Tracking Poll, Oct. 27–Nov. 2, 2025).
- 11% of U.S. adults said they currently take a GLP-1 for weight loss in 2026, up from 3% in 2024 (Gallup, survey May 28–June 5, 2026; revised Sept. 8, 2026).
- 26.5% of U.S. adults with diagnosed diabetes—an estimated 6.9 million people—used a GLP-1 injectable in 2024 (CDC National Center for Health Statistics).
- In Real Chemistry’s obesity-focused claims analysis, Kentucky had the highest patient share with an included GLP-1 claim (1.9%) and Hawaii the lowest (0.4%) in the 12 months to Sept. 30, 2024. These are patients in that dataset, not all state residents.
On this page: State rankings · The "1 in 4" figure · Medicaid by state, 2025 · What share of people · Which number to use · Why now · Method · Limits · Cite · Download · FAQ · Sources
Which states use GLP-1s the most?
Pennsylvania leads the 2025 Medicaid prescription-rate list; Alaska leads the 2024 Medicare claim-share list. West Virginia is the only state in the top 10 on all three lists below, and Alaska, Alabama, Kentucky, Louisiana, Oklahoma and Pennsylvania appear on two. The third list audits a publisher’s map; its underlying claims extract was not available. None of these lists measures current use among all state residents. Sources and method.
Here's what each column counts, in plain words.
Medicaid, 2025: Reported GLP-1 prescriptions for every 1,000 average monthly Medicaid enrollees. Refills count. The state identifies the Medicaid program reporting the records. CMS prescriptions; enrollment.
Medicare, 2024: GLP-1 claims as a share of published Medicare Part D claims attributed to prescribers practicing in the state. A share lets small and large states sit side by side. Published inputs and methods.
Publisher-map audit, 2024: Counts labeled as prescriptions by GLP-1 Newsroom, divided by Census residents. The publisher attributes its data to Purple Lab, but does not provide the raw extract or a count of distinct users. We checked what the page says and its math—not the source records. Do not cite this column as verified prescription totals or population use.
Enter a state name or two-letter code. Use the column controls to sort the published rates.
No state matches. Try the full name or the two-letter code.
| State | Reported Medicaid prescriptions per 1,000 average monthly enrollees, 2025 (rank of 51) | Medicare GLP-1 share of Part D claims, 2024 (rank of 51) | Publisher-map audit: stated prescriptions per 100 residents, 2024 (rank of 50; raw counts unverified) | Top-10 list appearances |
|---|---|---|---|---|
| Alabama | 94.2 (38) | 1.584% (4) | 19.3 (5) | 2 |
| Alaska | 109.2 (32) | 1.757% (1) | 17.4 (8) | 2 |
| Arizona | 56.0 (46) | 1.205% (36) | 8.1 (45) | 0 |
| Arkansas | 32.6 (51) | 1.238% (29) | 17.3 (9) | 1 |
| California | 256.5 (5) | 1.227% (31) | 9.5 (42) | 1 |
| Colorado | 115.8 (29) | 1.140% (44) | 7.8 (47) | 0 |
| Connecticut | 195.3 (12) | 1.326% (18) | 13.1 (24) | 0 |
| Delaware | 240.8 (7) | 1.287% (25) | 10.8 (37) | 1 |
| District of Columbia | 114.4 (31) | 1.364% (15) | Not published | 0 (2 lists available) |
| Florida | 38.0 (49) | 1.111% (48) | 10.4 (39) | 0 |
| Georgia | 34.6 (50) | 1.399% (12) | 15.2 (14) | 0 |
| Hawaii | 82.0 (41) | 1.420% (8) | 5.1 (50) | 1 |
| Idaho | 154.5 (17) | 1.416% (9) | 14.4 (17) | 1 |
| Illinois | 102.4 (35) | 1.172% (42) | 12.9 (25) | 0 |
| Indiana | 123.7 (24) | 1.399% (11) | 12.7 (27) | 0 |
| Iowa | 150.5 (18) | 1.237% (30) | 16.3 (11) | 0 |
| Kansas | 150.4 (19) | 1.242% (28) | 15.3 (13) | 0 |
| Kentucky | 222.6 (8) | 1.313% (20) | 22.0 (2) | 2 |
| Louisiana | 173.1 (14) | 1.653% (3) | 20.3 (3) | 2 |
| Maine | 131.8 (22) | 1.309% (23) | 12.7 (26) | 0 |
| Maryland | 120.6 (26) | 1.223% (33) | 9.6 (41) | 0 |
| Massachusetts | 280.0 (3) | 1.374% (14) | 10.9 (35) | 1 |
| Michigan | 278.4 (4) | 1.328% (17) | 15.8 (12) | 1 |
| Minnesota | 198.6 (11) | 1.127% (46) | 10.8 (38) | 0 |
| Mississippi | 119.7 (27) | 1.309% (22) | 18.7 (6) | 1 |
| Missouri | 251.1 (6) | 1.208% (35) | 14.0 (21) | 1 |
| Montana | 116.6 (28) | 1.105% (49) | 11.1 (34) | 0 |
| Nebraska | 122.5 (25) | 1.164% (43) | 13.6 (23) | 0 |
| Nevada | 100.8 (36) | 1.313% (21) | 7.4 (49) | 0 |
| New Hampshire | 209.6 (9) | 1.175% (40) | 11.3 (33) | 1 |
| New Jersey | 108.4 (33) | 1.198% (37) | 14.0 (20) | 0 |
| New Mexico | 98.7 (37) | 1.434% (7) | 12.2 (30) | 1 |
| New York | 138.2 (21) | 1.330% (16) | 14.2 (19) | 0 |
| North Carolina | 191.5 (13) | 1.383% (13) | 12.3 (28) | 0 |
| North Dakota | 57.3 (45) | 1.216% (34) | 17.8 (7) | 1 |
| Ohio | 167.1 (16) | 1.196% (38) | 14.3 (18) | 0 |
| Oklahoma | 90.1 (40) | 1.674% (2) | 19.5 (4) | 2 |
| Oregon | 64.6 (43) | 1.053% (50) | 7.9 (46) | 0 |
| Pennsylvania | 304.0 (1) | 1.223% (32) | 17.1 (10) | 2 |
| Rhode Island | 168.9 (15) | 1.025% (51) | 7.5 (48) | 0 |
| South Carolina | 70.3 (42) | 1.411% (10) | 13.6 (22) | 1 |
| South Dakota | 124.3 (23) | 1.134% (45) | 10.9 (36) | 0 |
| Tennessee | 108.3 (34) | 1.301% (24) | 14.9 (16) | 0 |
| Texas | 44.9 (47) | 1.579% (5) | 14.9 (15) | 1 |
| Utah | 91.8 (39) | 1.248% (27) | 8.5 (44) | 0 |
| Vermont | 114.6 (30) | 1.326% (19) | 11.5 (32) | 0 |
| Virginia | 147.3 (20) | 1.185% (39) | 11.7 (31) | 0 |
| Washington | 63.7 (44) | 1.122% (47) | 9.0 (43) | 0 |
| West Virginia | 205.8 (10) | 1.507% (6) | 24.2 (1) | 3 |
| Wisconsin | 286.9 (2) | 1.174% (41) | 10.0 (40) | 1 |
| Wyoming | 41.3 (48) | 1.263% (26) | 12.2 (29) | 0 |
Source: The RX Index calculations from CMS Medicaid prescriptions and enrollment; 2024 Medicare inputs from our published state dataset; and a separate audit of GLP-1 Newsroom’s stated counts against Census population. CMS suppresses some cells. Bold marks membership in all three top-10 lists, not a population-use finding. DC has two available lists. Ranks use unrounded ratios. Checked Sept. 29, 2026.
Where do the three top-10 lists agree?
Only on West Virginia. Six more states land on two lists. After that, the lists split.
| Rank | Publisher-map audit per 100 residents, 2024 (raw counts unverified) | Medicare GLP-1 share of Part D claims, 2024 | Reported Medicaid prescriptions per 1,000 average monthly enrollees, 2025 |
|---|---|---|---|
| 1 | West Virginia (24.2) | Alaska (1.757%) | Pennsylvania (304.0) |
| 2 | Kentucky (22.0) | Oklahoma (1.674%) | Wisconsin (286.9) |
| 3 | Louisiana (20.3) | Louisiana (1.653%) | Massachusetts (280.0) |
| 4 | Oklahoma (19.5) | Alabama (1.584%) | Michigan (278.4) |
| 5 | Alabama (19.3) | Texas (1.579%) | California (256.5) |
| 6 | Mississippi (18.7) | West Virginia (1.507%) | Missouri (251.1) |
| 7 | North Dakota (17.8) | New Mexico (1.434%) | Delaware (240.8) |
| 8 | Alaska (17.4) | Hawaii (1.420%) | Kentucky (222.6) |
| 9 | Arkansas (17.3) | Idaho (1.416%) | New Hampshire (209.6) |
| 10 | Pennsylvania (17.1) | South Carolina (1.411%) | West Virginia (205.8) |
Source: Same inputs and limits as Table 1. The publisher-map column audits a published claim; its raw counts are not independently verified. Checked Sept. 29, 2026.
Look at Alaska. It's first on the Medicare measure and 32nd on Medicaid. Arkansas is ninth on the publisher-map calculation and has the lowest reported Medicaid prescription rate.
We checked how closely the rankings move together across the 50 states, leaving out DC. The publisher-map ranking and the Medicare ranking agree somewhat (a Spearman rank correlation of 0.52, where 1 is a perfect match). The Medicaid ranking barely tracks either one (0.08 and −0.04, close to no pattern at all). Those calculations compare lists with different sources and years; they do not show why the lists differ. Calculation inputs.
What does Medicare show by state?
Alaska had the highest GLP-1 share of Medicare Part D claims in 2024, at 1.757%. California prescribers wrote the most GLP-1 claims, 1,865,079. Our Medicare GLP-1 prescriptions by state analysis has the full 2019–2024 series, brand mix and methods.
Medicare counts claims by where the prescriber practices, not where the patient lives. If you're a Medicare member weighing plans, our guide on choosing a Medicare Advantage plan for GLP-1 coverage walks through what actually decides it.
Do 1 in 4 people in Kentucky really take a GLP-1?
The cited map does not establish that. Its Kentucky count divided by Census residents gives 22.0 prescriptions per 100 residents, not 22% of people taking a GLP-1. The map does not supply the raw data needed to check distinct users. Dividing again by an assumed refill pace gives a scenario—not Kentucky’s true usage rate. Original map.
Picture a neighbor on a weekly GLP-1 pen. She picks up a new box every month. By December, that's 12 prescriptions. A map that divides prescriptions by people counts her 12 times.
Where did the 22% come from?
In May 2025, GLP-1 Newsroom published a state-by-state GLP-1 map that it attributed to 2024 insurance claims from Purple Lab, a health analytics company. For each state it listed a prescription count and a "statewide GLP-1 usage" percentage. The author explained that she used prescription counts and state population to calculate those percentages.
We redid that division for all 50 states using the Census Bureau's July 1, 2024 population estimates. Every published percentage was within 0.7 percentage points of that calculation. Kentucky: 1,009,621 prescriptions ÷ 4,588,372 residents = 22.0%.
Then the number traveled. Fox News listed the states above 15% as places where that share of the population "received GLP-1 prescriptions" (Nov. 9, 2025). A Kentucky Health News story, published in The State-Journal, called it "one in four adults."
We could verify the numbers printed on the page, but not its underlying claims extract, drug list or definition of a prescription. The division does not establish a share of people: prescription counts can include refills, and the population includes kids.
How much do repeat prescriptions change the math?
CMS publishes Medicare prescription claims and the number of beneficiaries—the people covered by the program—behind them, product by product. In 2024, Medicare Part D reported 21,825,833 claims for the included GLP-1 products and 4,166,903 summed product-level beneficiaries. A person who switched products can appear more than once in that sum. Dividing gives 5.2379 claims per summed beneficiary, so the average for distinct users is at least 5.2 prescriptions per person. This is an average, not a minimum for each patient.
Drug by drug, the averages are similar: 5.34 claims per beneficiary for Ozempic, 5.71 for Mounjaro and 5.46 for Trulicity. State averages for Ozempic ranged from 4.44 in Delaware to 6.06 in North Dakota, with a median of 5.19 across the 50 states and DC. Those Medicare averages do not establish a refill pace for another source, insurer or population. CMS source; product-level inputs.
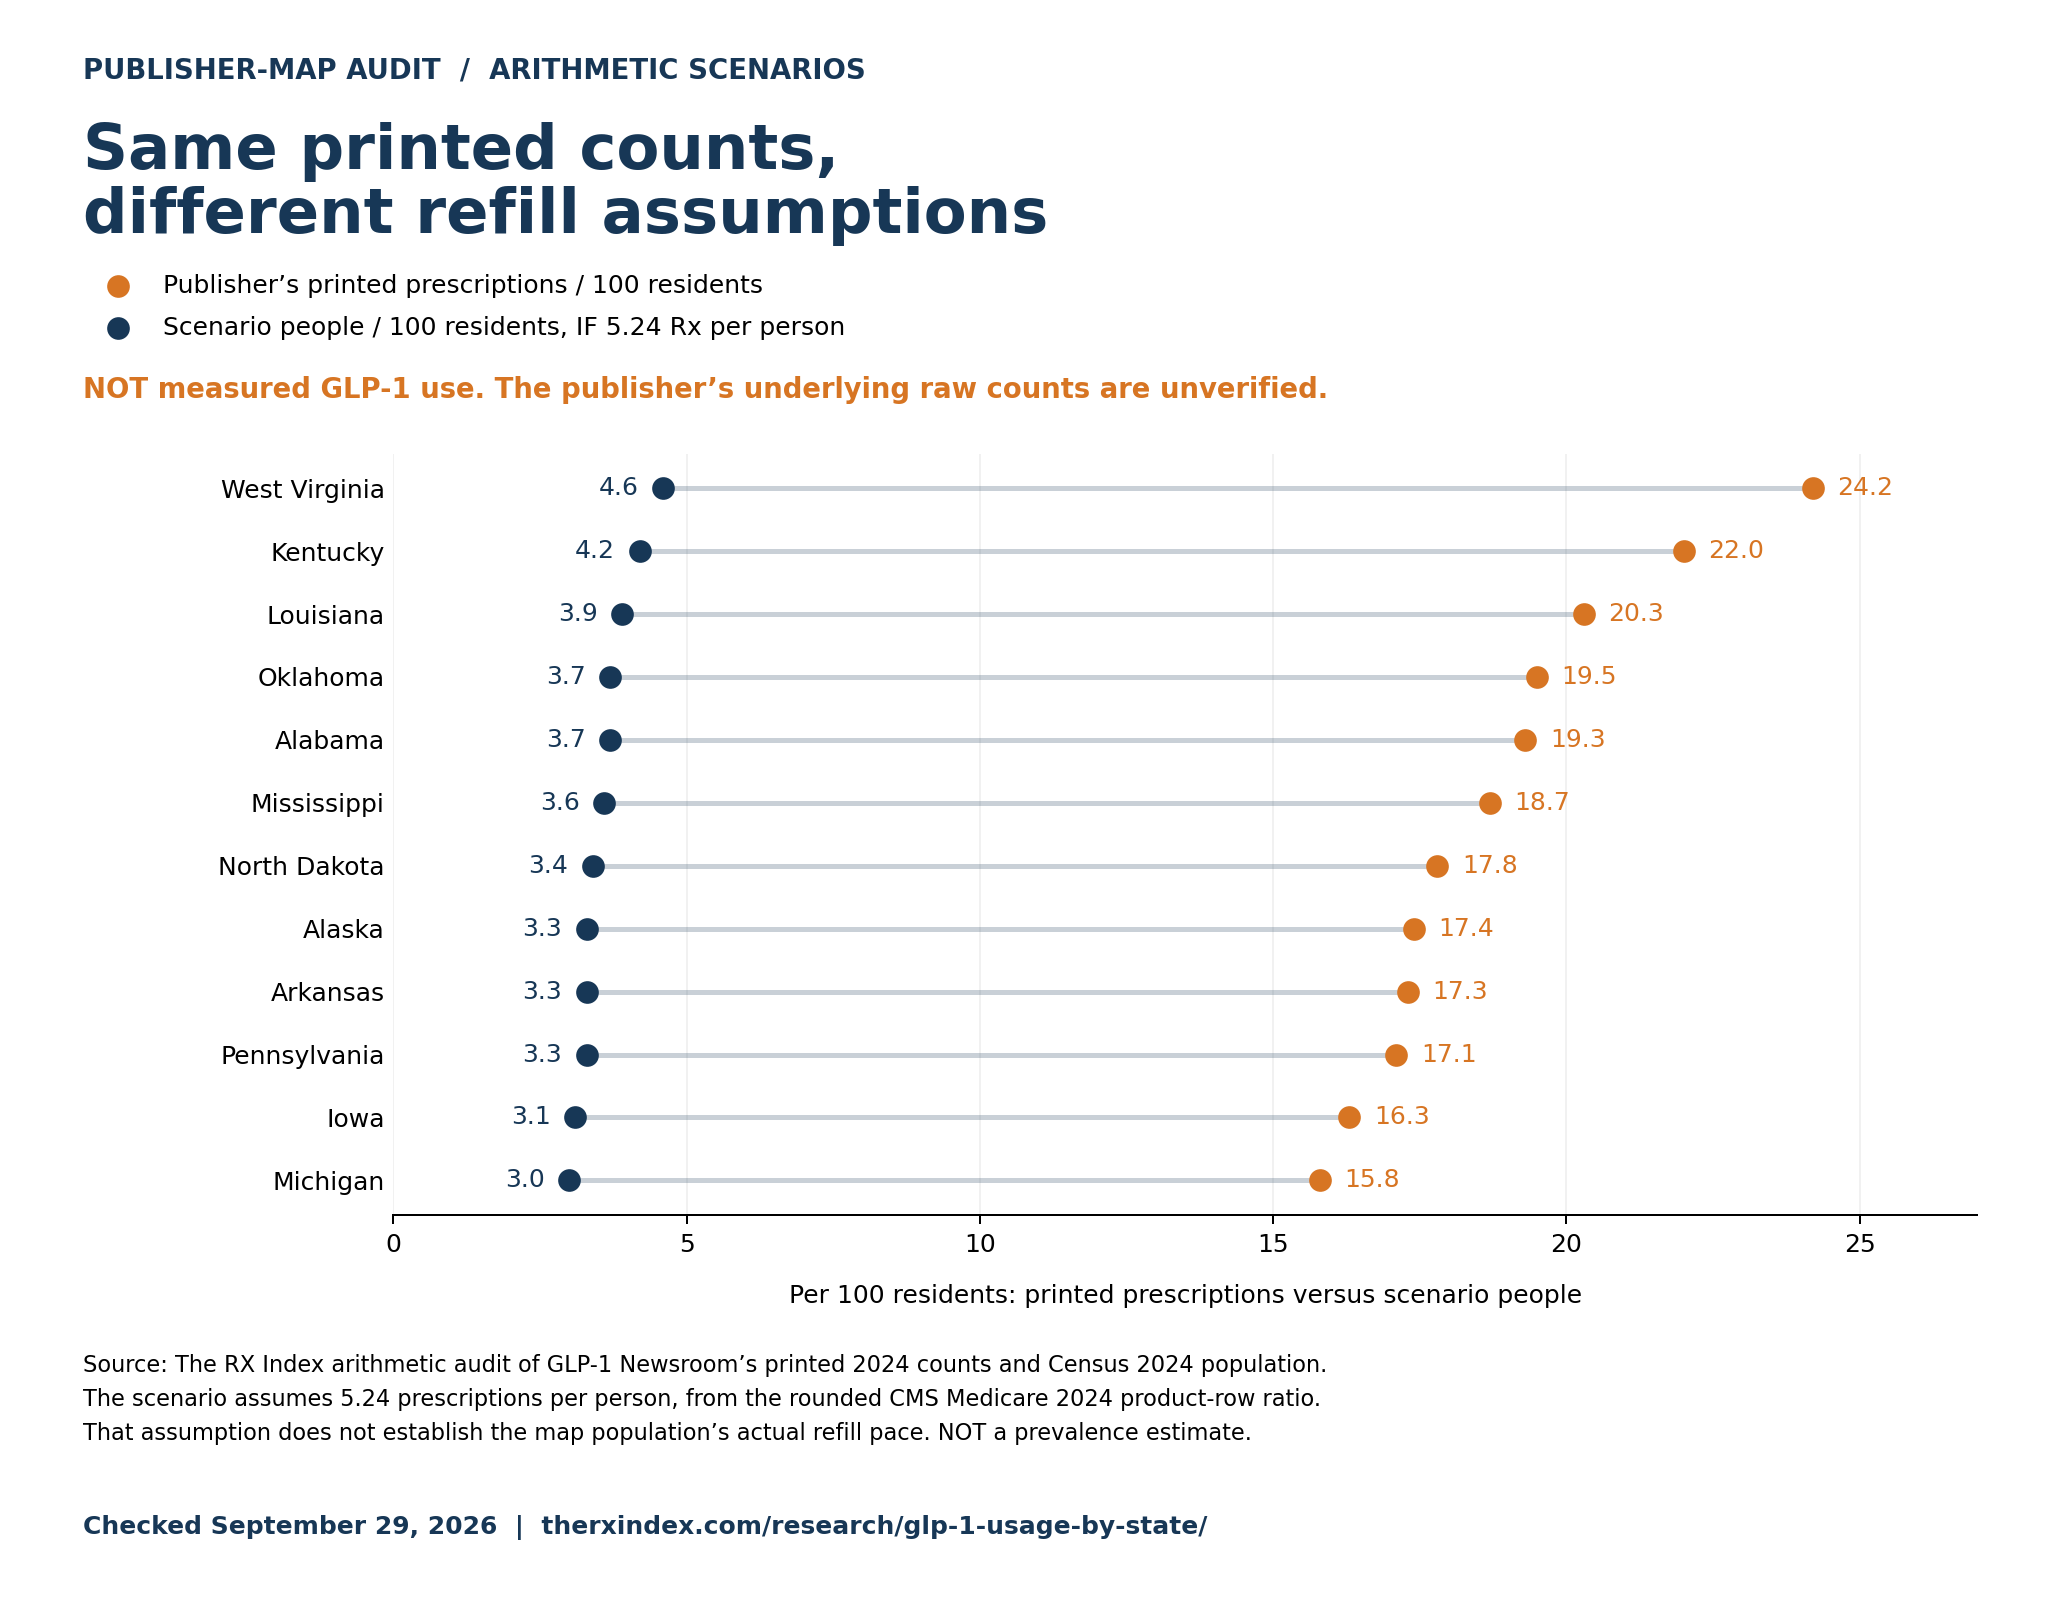
Now try two assumptions for the 12 states the map labeled above 15%. These scenarios show the effect of repeat prescriptions; neither estimates a state’s actual users.
| State | Publisher’s stated "statewide usage" (not verified prevalence) | Publisher’s count ÷ residents × 100 | Scenario assuming 5.24 prescriptions per person | Scenario assuming 3 prescriptions per person |
|---|---|---|---|---|
| West Virginia | 24% | 24.2 | 4.6% | 8.1% |
| Kentucky | 22% | 22.0 | 4.2% | 7.3% |
| Louisiana | 20% | 20.3 | 3.9% | 6.8% |
| Oklahoma | 20% | 19.5 | 3.7% | 6.5% |
| Alabama | 19% | 19.3 | 3.7% | 6.4% |
| Mississippi | 19% | 18.7 | 3.6% | 6.2% |
| North Dakota | 18% | 17.8 | 3.4% | 5.9% |
| Alaska | 17% | 17.4 | 3.3% | 5.8% |
| Arkansas | 17% | 17.3 | 3.3% | 5.8% |
| Pennsylvania | 17% | 17.1 | 3.3% | 5.7% |
| Iowa | 16.5% | 16.3 | 3.1% | 5.4% |
| Michigan | 16% | 15.8 | 3.0% | 5.3% |
Source: The RX Index arithmetic audit of GLP-1 Newsroom’s printed 2024 counts and Census population. The 5.24 assumption is the rounded Medicare product-row ratio; 3 is an illustrative assumption, not a measured alternative. Raw map counts are unverified. Scenario percentages are not actual state-use estimates. Checked Sept. 29, 2026.
Why a 3-per-person column? It shows what happens when we choose a lower refill assumption. It is not a lower bound or a measured pace. West Virginia’s scenario then gives 8.1%, under 1 in 10—not a claim that actual use is below 10%. Across all 50 states, the publisher’s 43,888,857 stated prescriptions divided by 339,408,738 residents give 12.9 per 100; dividing again by the assumed 5.24 gives about 2.5%. Those are calculations from the map, not a national estimate of users.
People-based sources answer different questions. In commercial insurance, FAIR Health found 4.0% of adult patients were prescribed a GLP-1 in 2024. In its May 2024 report, KFF found 6% of U.S. adults reported current use for any reason; it surveyed them April 23–May 1. Neither national figure establishes Kentucky’s rate or sets a ceiling on it.
What does the data say about Kentucky?
Kentucky appears in the cited stories with a 22% figure, so here are its source-specific results and the map scenario side by side.
| Measure | Kentucky | Rank | Period | Source |
|---|---|---|---|---|
| Publisher-map audit: stated prescriptions per 100 residents | 22.0 | 2 of 50 in the map calculation | 2024 | GLP-1 Newsroom printed counts ÷ Census population; raw counts unverified |
| Scenario assuming 5.24 prescriptions per person | 4.2% of residents, if that assumption held | — | Arithmetic using the publisher’s 2024 counts | The RX Index; not measured prevalence |
| Share of all patients with a GLP-1 claim (obesity-linked use) | 1.9% | 1 (highest in the study) | 12 months to Sept. 30, 2024 | Real Chemistry |
| People whose GLP-1s Kentucky Medicaid paid for | 76,195, as reported by a Cabinet spokesperson | — | Fiscal year July 2023–June 2024 | Kentucky Cabinet for Health and Family Services, as reported by the Kentucky Lantern |
| Medicaid GLP-1 prescriptions per 1,000 enrollees | 222.6 | 8 of 51 | 2025 | The RX Index analysis of CMS data |
| Medicare GLP-1 share of Part D claims | 1.313% | 20 of 51 | 2024 | The RX Index analysis of CMS data |
Source: As listed in each row. Checked Sept. 29, 2026.
The Kentucky Lantern attributed the 76,195 figure to a Cabinet for Health and Family Services spokesperson, not a public claims extract. For scale, it equals about 1.7% of Kentucky’s July 2024 Census population—roughly 1 in 60—but the fiscal-year numerator and population snapshot cover different periods. The spokesperson described diabetes-only coverage at the time of the February 2025 story. None of these figures establishes current use among all Kentuckians or proves that use is 4.2% rather than 22%.
Try the math for your state
Pick a state and the tool fills in the count printed by the map publisher and the 2024 Census population. Then change the assumed prescriptions per person to see how the result moves. It starts at 5.24, the rounded Medicare product-row ratio. The point isn’t to estimate actual users. It’s to show why prescriptions per resident and people using a medicine are not the same number.
This is conditional arithmetic, not an estimate of actual state prevalence and not a check of the publisher’s raw counts. Assumption: 5.24, the rounded Medicare 2024 product-row ratio—not a measured state refill rate. These inputs cannot describe distinct users within this population. Not measured use. The publisher’s underlying claims extract is unavailable, and Medicare’s refill pace cannot establish another population’s rate. Default scenario source: CMS national 2024 product rows, 21,825,833 claims divided by 4,166,903 summed product-level beneficiaries (5.237902826, rounded to 5.24). The strict rounded-down average lower bound is 5.2, not 5.24.Prescriptions-to-people scenario
How many GLP-1 prescriptions did Medicaid fill in each state in 2025?
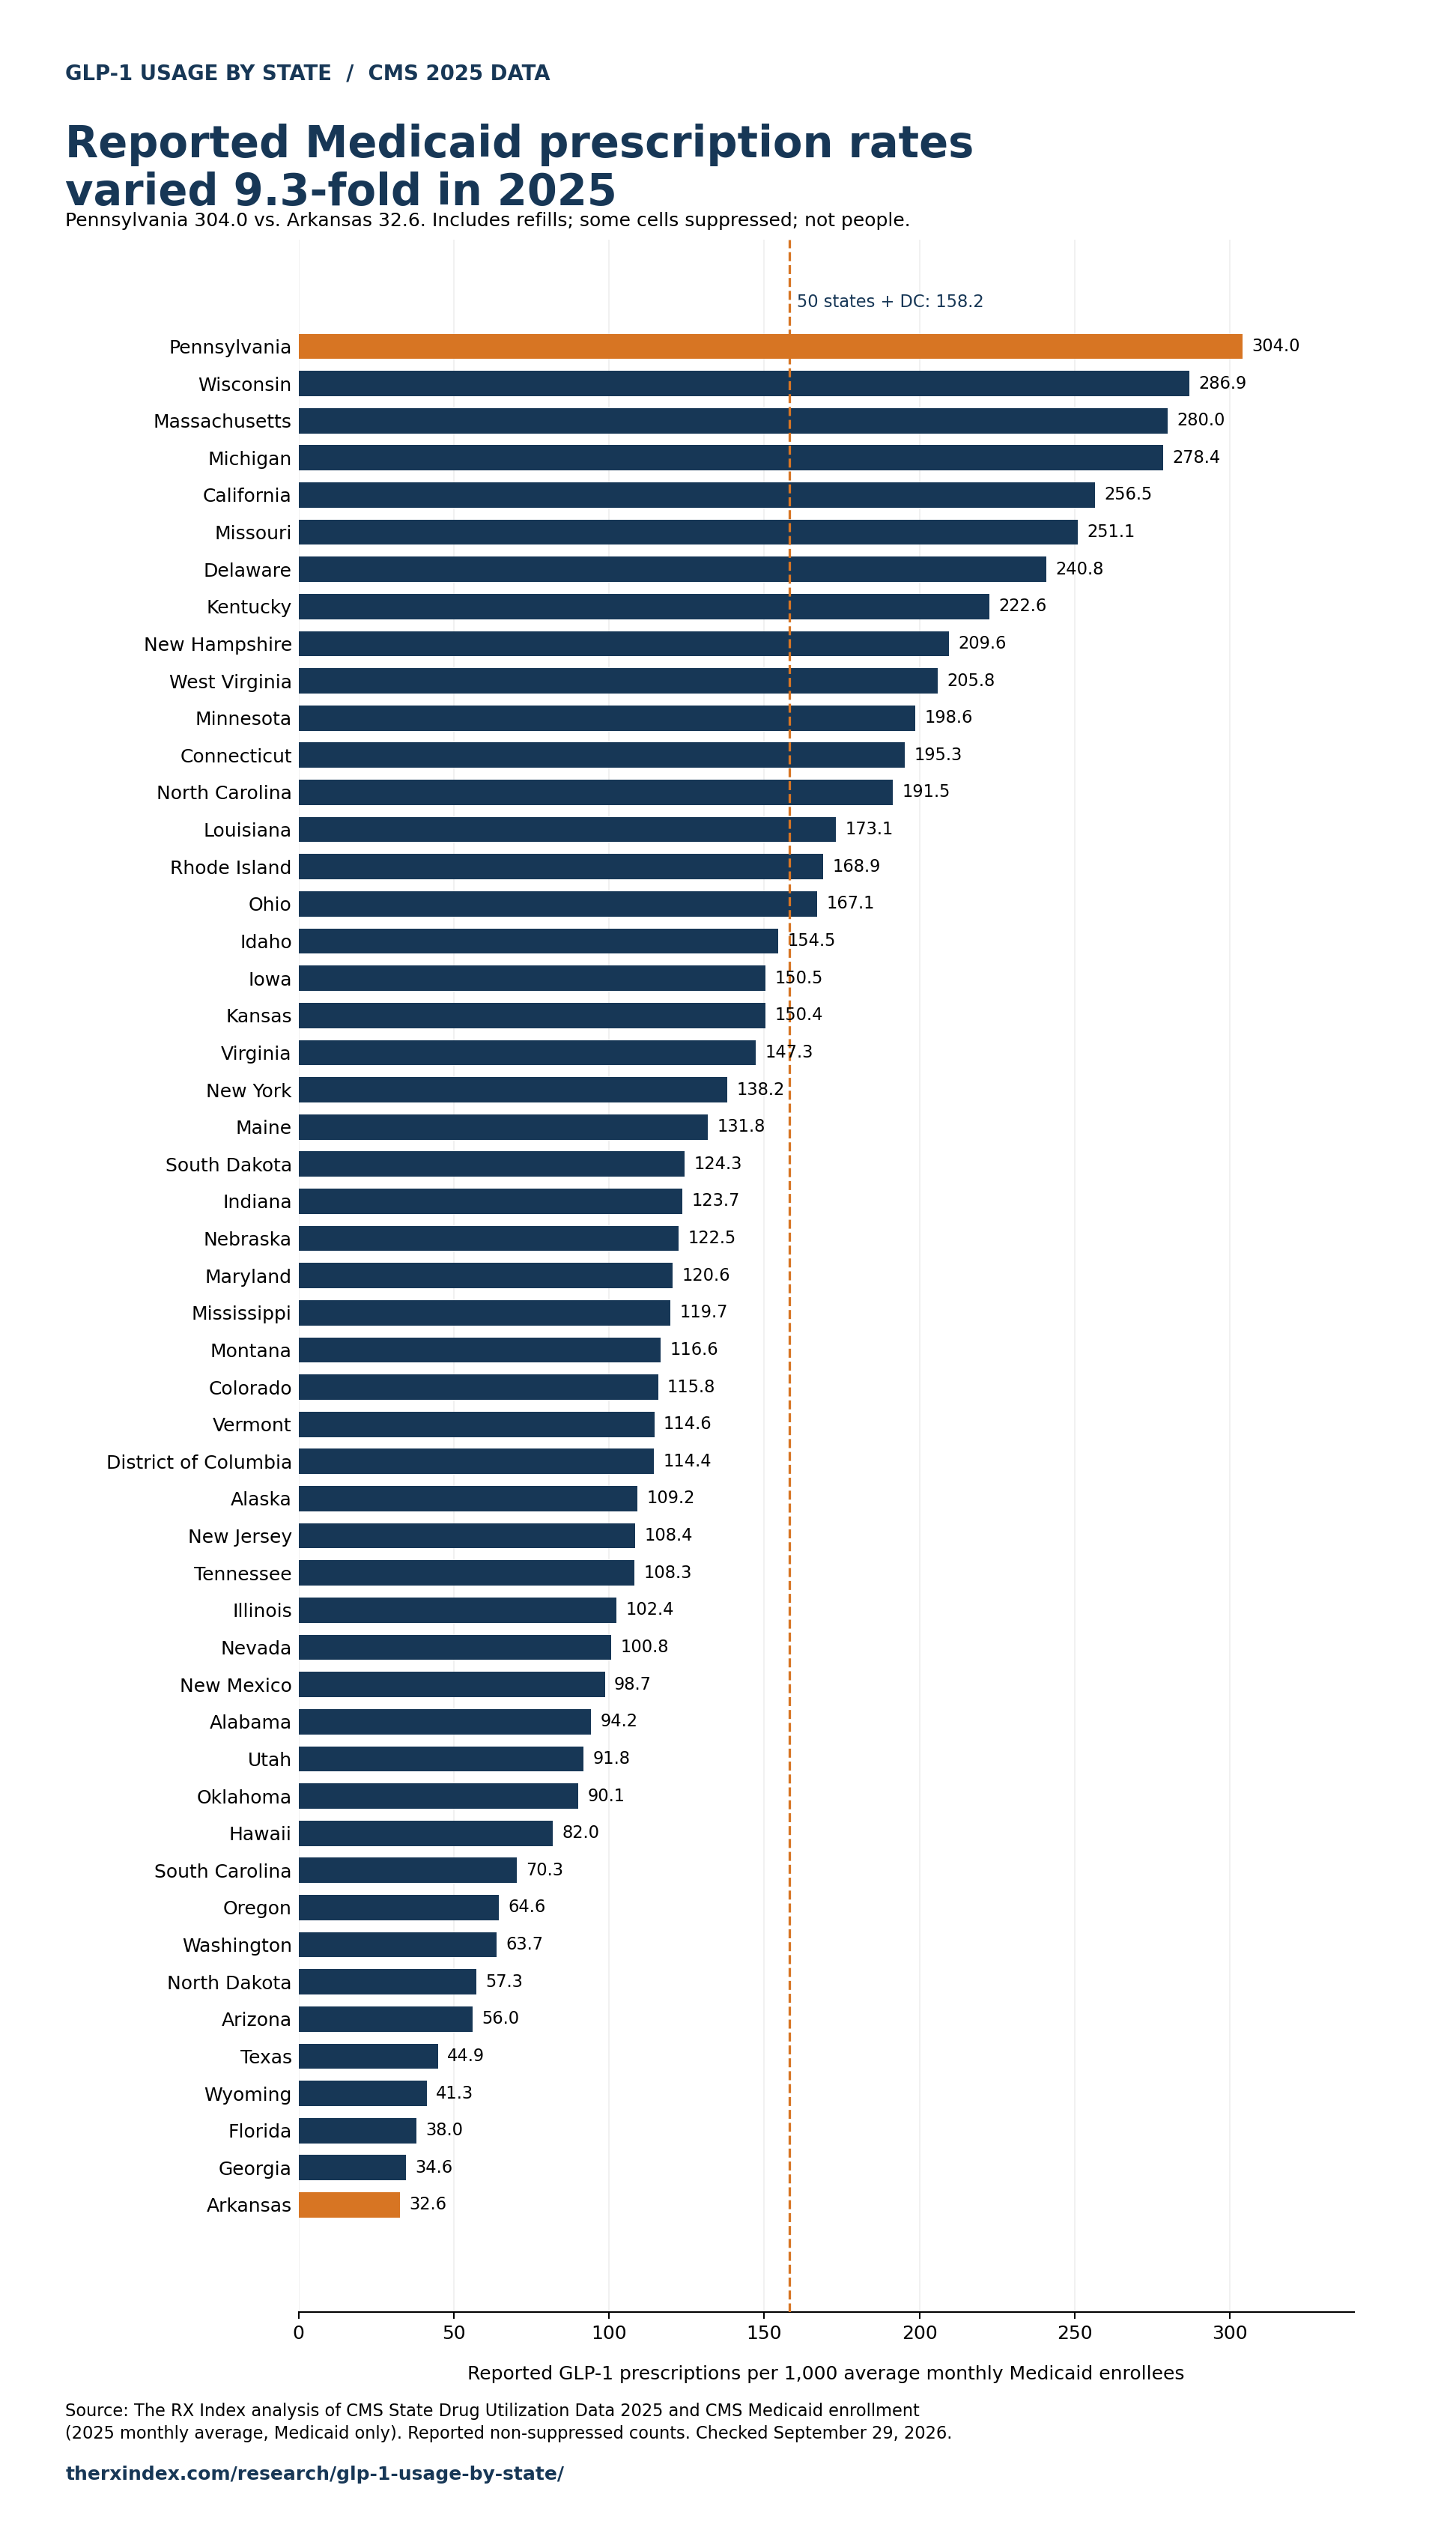
Medicaid reported 11.26 million GLP-1 prescriptions in 2025, up 35% from 8.35 million in 2024. Per 1,000 average monthly enrollees, Pennsylvania reported the most (304.0) and Arkansas the fewest (32.6), a 9.3-fold gap. These count prescriptions, including refills—not distinct patients. CMS prescriptions; enrollment.
Think of it per 100 people on Medicaid. Pennsylvania filled about 30 GLP-1 prescriptions for every 100 enrollees. Arkansas filled about 3. Across all 50 states and DC, it was about 16 (158.2 per 1,000).
Medicaid is worth a close look because its state reports let us use one method across all 50 states and DC. That is a useful program-level comparison, not an age-adjusted measure of treatment need. It covers Medicaid, so it isn’t a picture of everyone. Some prescription cells are suppressed, and average monthly enrollment is not the number of distinct people enrolled at any point in the year.
| Rank | State | Reported GLP-1 prescriptions, 2025 | Average monthly Medicaid enrollment, 2025 | Prescriptions per 1,000 enrollees | All-age prescriptions per 1,000 adult enrollees—not an adult-use rate | Change in prescriptions, 2024 to 2025 |
|---|---|---|---|---|---|---|
| 1 | Pennsylvania | 843,743 | 2,775,582 | 304.0 | 520.0 | +47.1% |
| 2 | Wisconsin | 302,633 | 1,055,015 | 286.9 | 501.4 | +50.0% |
| 3 | Massachusetts | 399,014 | 1,425,239 | 280.0 | 432.3 | +56.8% |
| 4 | Michigan | 607,982 | 2,183,464 | 278.4 | 422.6 | +52.9% |
| 5 | California | 3,089,327 | 12,042,894 | 256.5 | 369.0 | +61.7% |
| 6 | Missouri | 285,105 | 1,135,252 | 251.1 | 419.6 | +120.6% |
| 7 | Delaware | 55,674 | 231,249 | 240.8 | 408.5 | +38.7% |
| 8 | Kentucky | 274,170 | 1,231,683 | 222.6 | 369.3 | +12.3% |
| 9 | New Hampshire | 34,652 | 165,300 | 209.6 | 365.7 | +56.8% |
| 10 | West Virginia | 94,999 | 461,518 | 205.8 | 315.3 | +2.4% |
| 11 | Minnesota | 230,594 | 1,161,003 | 198.6 | 409.7 | +39.3% |
| 12 | Connecticut | 174,430 | 892,966 | 195.3 | 316.6 | −18.4% |
| 13 | North Carolina | 484,401 | 2,530,039 | 191.5 | 335.7 | +115.0% |
| 14 | Louisiana | 230,117 | 1,329,298 | 173.1 | 298.6 | −14.9% |
| 15 | Rhode Island | 46,691 | 276,403 | 168.9 | 249.0 | +27.3% |
| 16 | Ohio | 425,143 | 2,544,202 | 167.1 | 267.8 | +15.6% |
| 17 | Idaho | 45,954 | 297,375 | 154.5 | 284.4 | −2.4% |
| 18 | Iowa | 88,518 | 588,240 | 150.5 | 261.6 | +26.5% |
| 19 | Kansas | 50,850 | 338,205 | 150.4 | 395.7 | +59.6% |
| 20 | Virginia | 227,472 | 1,543,826 | 147.3 | 249.9 | +2.1% |
| 21 | New York | 815,882 | 5,905,300 | 138.2 | 198.5 | +15.8% |
| 22 | Maine | 41,655 | 316,073 | 131.8 | 205.5 | +22.2% |
| 23 | South Dakota | 15,521 | 124,843 | 124.3 | 254.8 | +32.5% |
| 24 | Indiana | 190,013 | 1,536,199 | 123.7 | 213.0 | −4.4% |
| 25 | Nebraska | 37,324 | 304,590 | 122.5 | 225.4 | +7.8% |
| 26 | Maryland | 148,487 | 1,230,930 | 120.6 | 197.1 | +10.5% |
| 27 | Mississippi | 61,646 | 514,914 | 119.7 | 306.5 | +49.8% |
| 28 | Montana | 22,719 | 194,779 | 116.6 | 185.8 | +1.7% |
| 29 | Colorado | 123,001 | 1,061,751 | 115.8 | 181.4 | +60.4% |
| 30 | Vermont | 17,163 | 149,734 | 114.6 | 177.7 | +21.2% |
| 31 | District of Columbia | 27,754 | 242,673 | 114.4 | 169.7 | −7.7% |
| 32 | Alaska | 23,225 | 212,692 | 109.2 | 170.7 | −7.3% |
| 33 | New Jersey | 165,515 | 1,527,350 | 108.4 | 171.9 | +21.1% |
| 34 | Tennessee | 135,961 | 1,254,904 | 108.3 | 231.9 | +46.2% |
| 35 | Illinois | 288,470 | 2,816,513 | 102.4 | 167.2 | +8.9% |
| 36 | Nevada | 70,791 | 702,479 | 100.8 | 165.6 | +29.3% |
| 37 | New Mexico | 64,832 | 657,171 | 98.7 | 168.2 | +13.2% |
| 38 | Alabama | 71,772 | 761,509 | 94.2 | 263.1 | +7.6% |
| 39 | Utah | 27,850 | 303,434 | 91.8 | 167.2 | +25.4% |
| 40 | Oklahoma | 82,353 | 913,643 | 90.1 | 174.0 | +20.1% |
| 41 | Hawaii | 30,455 | 371,302 | 82.0 | 126.0 | −34.3% |
| 42 | South Carolina | 65,093 | 925,799 | 70.3 | 162.7 | +11.4% |
| 43 | Oregon | 72,779 | 1,126,553 | 64.6 | 87.1 | +27.0% |
| 44 | Washington | 111,160 | 1,745,204 | 63.7 | 113.7 | +8.0% |
| 45 | North Dakota | 5,852 | 102,124 | 57.3 | 106.3 | +5.7% |
| 46 | Arizona | 93,519 | 1,668,578 | 56.0 | 92.6 | +5.6% |
| 47 | Texas | 172,203 | 3,834,136 | 44.9 | 174.5 | +16.4% |
| 48 | Wyoming | 2,315 | 56,053 | 41.3 | 117.4 | −3.7% |
| 49 | Florida | 133,402 | 3,514,744 | 38.0 | 102.6 | +1.6% |
| 50 | Georgia | 59,336 | 1,713,965 | 34.6 | 105.9 | +11.2% |
| 51 | Arkansas | 24,039 | 736,685 | 32.6 | 59.3 | +27.3% |
Source: The RX Index analysis of CMS State Drug Utilization Data, 2025 and 2024, and CMS enrollment (2025 monthly average, Medicaid only). Products: Ozempic, Wegovy, Mounjaro, Zepbound, Trulicity, Victoza, Rybelsus, Saxenda, Bydureon, Byetta, generic liraglutide and generic exenatide. Reported non-suppressed counts; no imputation. Rates and ranks use exact enrollment averages, not the rounded enrollment shown. The adult column keeps an all-age prescription numerator. Checked Sept. 29, 2026.
Per enrollee or per adult enrollee?
The adult column changes only the denominator. It divides all-age prescriptions by average monthly adult enrollment; it does not isolate prescriptions filled by adults. Across the 50 states and DC, that gives 273.5 all-age prescriptions per 1,000 adult enrollees. CMS source fields; enrollment.
States with a smaller adult share of enrollment move up when we use that denominator. Texas goes from 44.9 per 1,000 enrollees to 174.5 all-age prescriptions per 1,000 adult enrollees. Pennsylvania still leads on this calculation (520.0), and Arkansas is still last (59.3). Neither adult-denominator result is a percentage of adults treated.
Where did Medicaid GLP-1 prescriptions grow fastest?
Prescriptions rose in 43 of 51 jurisdictions from 2024 to 2025. Missouri more than doubled (+120.6%), and so did North Carolina (+115.0%). California rose 61.7%. Hawaii fell the most (−34.3%), followed by Connecticut (−18.4%) and Louisiana (−14.9%). Every state's change is in Table 5.
These are changes in prescription counts. Enrollment also shifted during 2025, so a rising count doesn't always mean a rising rate.
What happened when states changed coverage?
North Carolina’s reported Medicaid GLP-1 prescriptions fell 50.6% from the third to the fourth quarter of 2025. Its obesity-only coverage was paused Oct. 1 and restored effective Dec. 12, so the pause ran through Dec. 11. Tennessee’s prescriptions rose 54.5% in the same stretch, after its obesity coverage began Aug. 1, 2025. These are changes during policy transitions, not estimates of policy effects.
Missouri went from 40,535 prescriptions in the first quarter to 100,219 in the fourth. Its policy document lists Jan. 9, 2025 as the first implementation date for the obesity-drug criteria.
| State | Q1 | Q2 | Q3 | Q4 |
|---|---|---|---|---|
| North Carolina | 111,109 | 138,646 | 157,108 | 77,538 |
| Missouri | 40,535 | 56,943 | 87,408 | 100,219 |
| Tennessee | 25,210 | 27,721 | 32,629 | 50,401 |
Source: CMS 2025 State Drug Utilization Data, same product filter as Table 5. These are reported prescription counts, not a causal policy estimate. Checked Sept. 29, 2026.
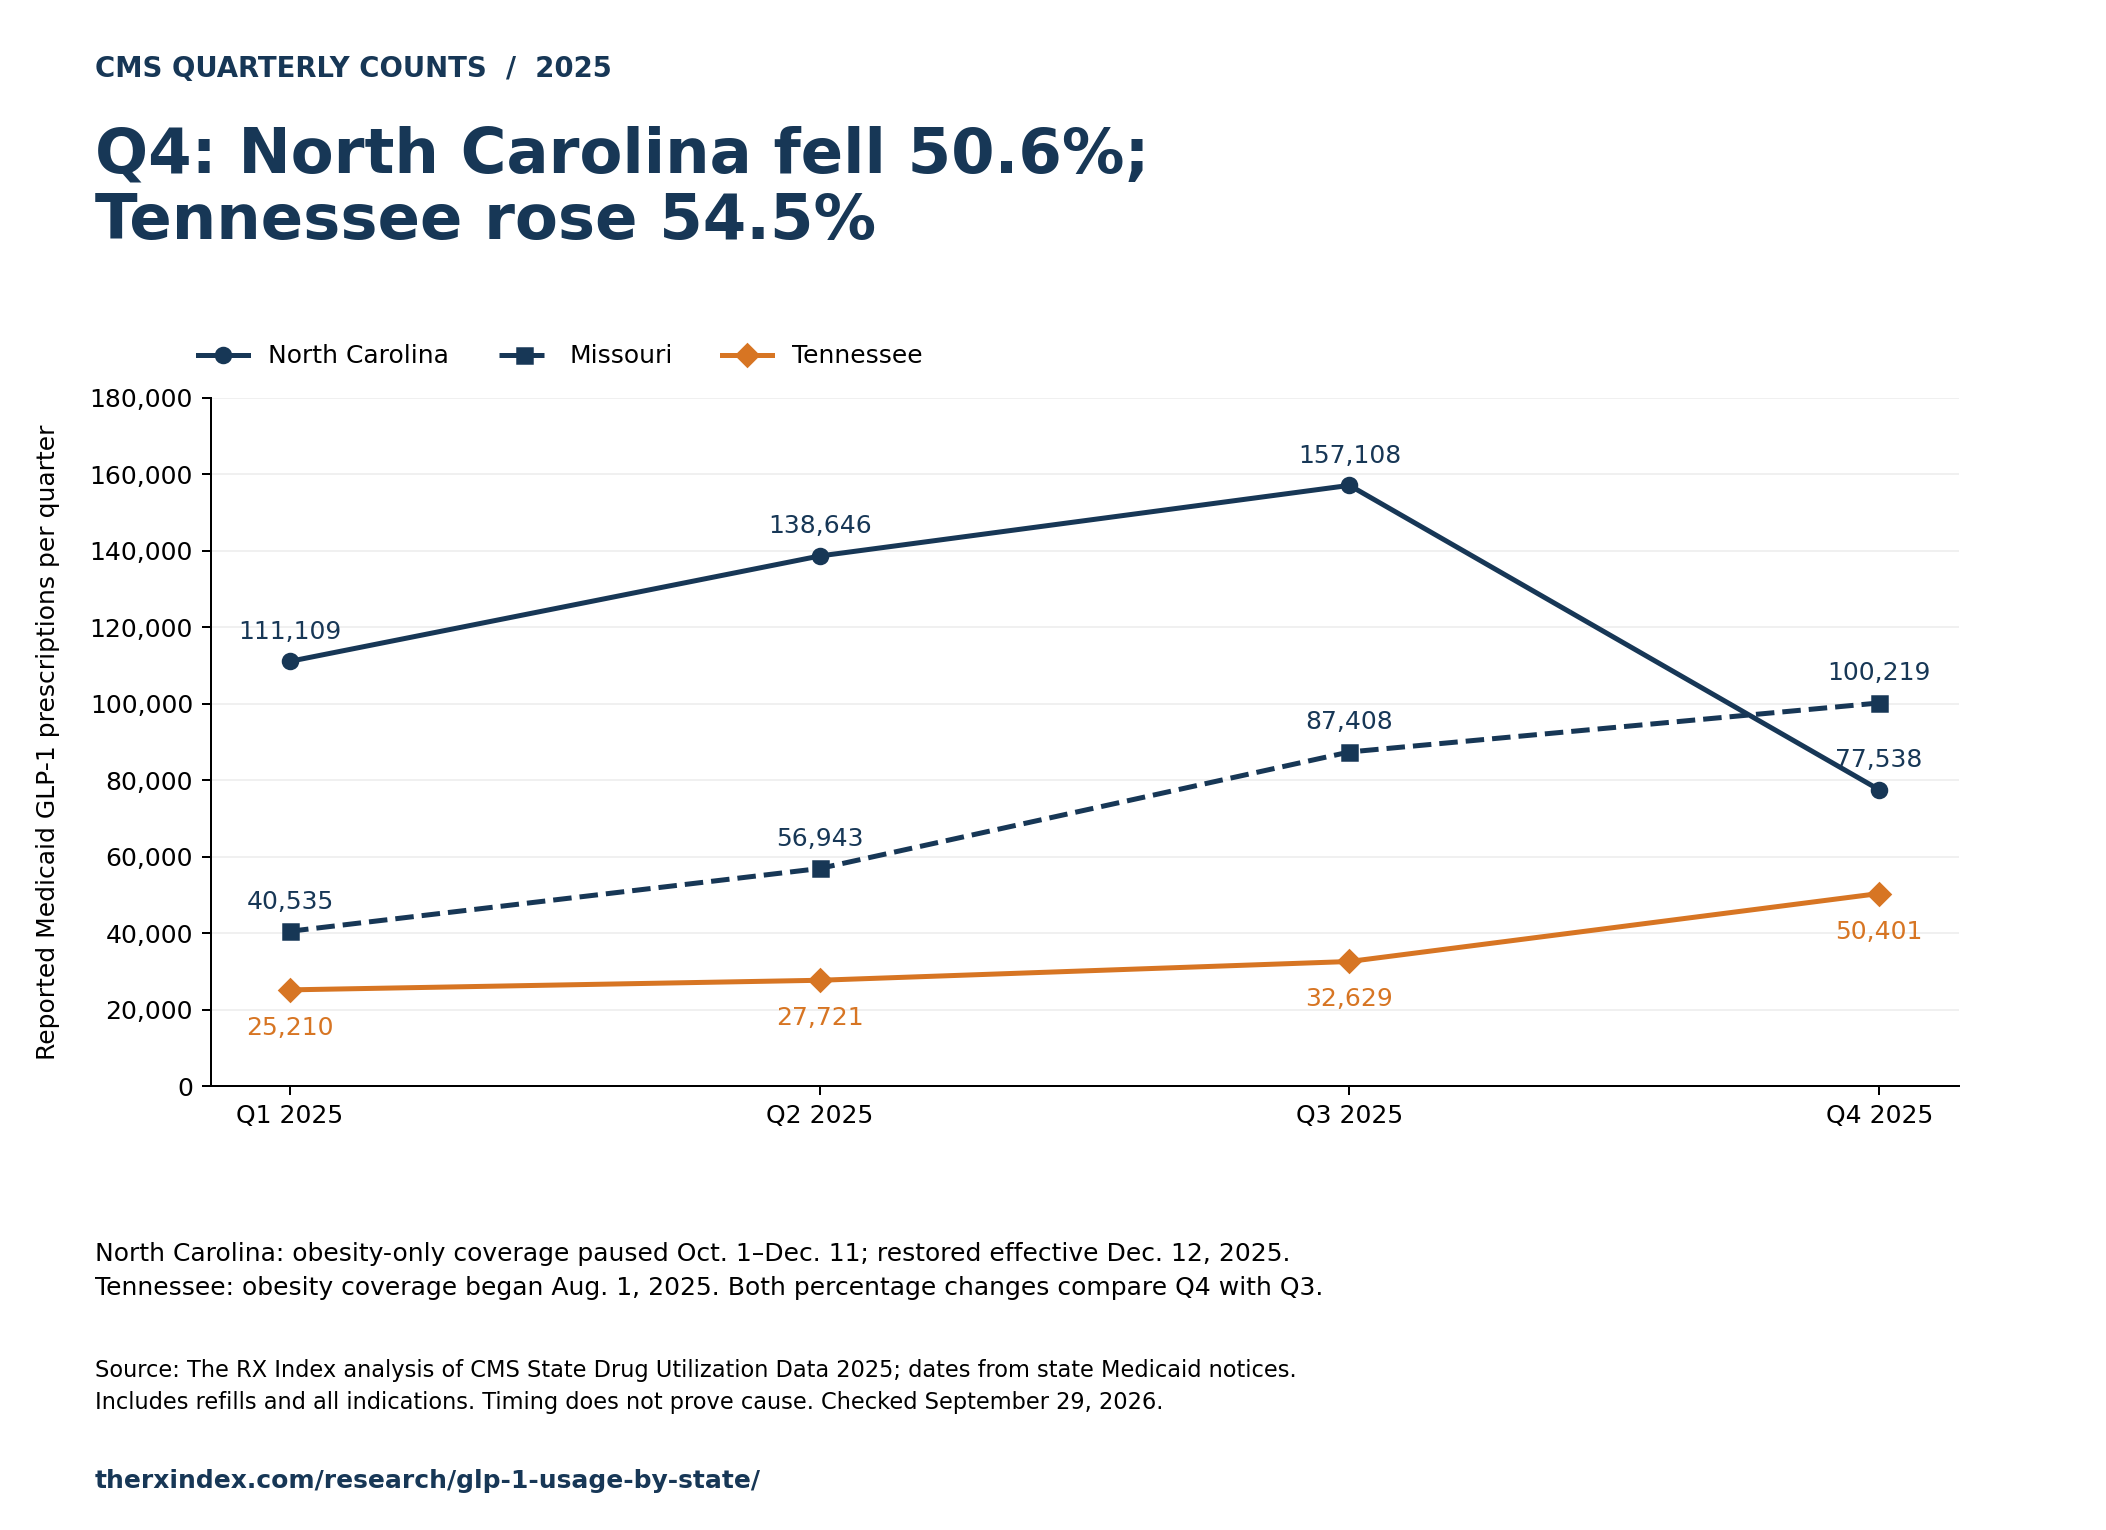
The timing lines up, but the data alone can’t prove the policy caused the change. A 2026 study of health records also reported a positive state-level association between a Medicaid obesity-coverage indicator and prescription orders (odds ratio 1.16). That model compared state-level data, not individual Medicaid patients; it does not show that coverage raised a person’s odds by 16%.
Rules keep changing. Each state's current policy is in our GLP-1 Medicaid coverage tracker. If you're trying to get a GLP-1 approved, our guide on how to get insurance to cover GLP-1 treatment walks through prior authorization and appeals.
What percentage of people use GLP-1s?
Nationally, 12% of U.S. adults said they were currently taking a GLP-1 for any reason in late 2025 (KFF), and 11% said they take one for weight loss in mid-2026 (Gallup). The sources reviewed here do not establish current use among every state’s residents. They include health records, insurance claims and a university survey with small state samples.
| Source | Figure | Who was counted | When | What it counts |
|---|---|---|---|---|
| KFF Health Tracking Poll | 12% current; 18% ever | U.S. adults | Oct. 27–Nov. 2, 2025 | Self-reported use for any reason |
| Gallup | 11% current; 15% ever | U.S. adults | May 28–June 5, 2026 | Self-reported use for weight loss |
| CDC National Center for Health Statistics | 26.5% (an estimated 6.9 million) | Adults with diagnosed diabetes | 2024 | Self-reported GLP-1 injectable use |
| FAIR Health | 4.0% | Commercially insured adult patients | 2024 | Patients prescribed a GLP-1 (claims) |
| Real Chemistry | 1.0% | All patients in its claims data | 12 months to Sept. 30, 2024 | Patients with an approved GLP-1 claim, counting Ozempic, Mounjaro and Rybelsus only with an obesity diagnosis |
Source: As linked in each row. Checked Sept. 29, 2026.
These don't line up because they don't count the same thing. Some ask people; some count paid claims. Some cover any reason; some only weight loss. Gallup revised its series on Sept. 8, 2026, so older articles may quote different Gallup numbers. The revised article reports 3% in 2024 and 11% in 2026.
Is there a state-by-state GLP-1 survey?
Yes. Kansas State University’s Meat Demand Monitor, a monthly national consumer survey, published a 2025 state map of self-declared GLP-1 use. Its report describes higher self-declared use in the Southeast. It also flags two small-sample states: North Dakota, 33.3% with 63 respondents, and Wyoming, 22.6% with 31.
For a simple, unweighted illustration, 21 yes answers out of 63 equal 33.3%, and 7 out of 31 equal 22.6%. Those are arithmetic examples, not verified counts of yes answers in KSU’s data. One changed answer in an unweighted sample of 31 moves the share by about 3.2 percentage points; that is not a margin of error. The report warns about small state samples because the survey is designed for national estimates, not precise estimates for every state.
How many adults who qualify for treatment get a prescription?
A 2026 study of Epic Cosmos health records included 57.8 million adults without type 2 diabetes who met its obesity-medication criteria: a body mass index (BMI) of at least 30, or at least 27 with a related condition. They also needed a recorded BMI and an in-person visit in the year before meeting those criteria. By state, 2.82% to 9.79% had an order for semaglutide or tirzepatide during the study’s July 2021–October 2025 window. The middle state was 6.46%.
In plain terms: the highest state proportion was about 1 in 10 eligible adults, and the lowest was about 1 in 35—roughly a 3.5-fold spread. Those proportions cover the study window, not equal follow-up of four-plus years for each person. The authors reported that higher eligibility in the South and Midwest did not come with matching higher order rates.
Two cautions. An order is a doctor's prescription in the record, not a filled one. And the paper shows state values only on a map, so we don't name its highest and lowest states.
What do insurance numbers leave out?
The Medicaid and Medicare datasets here leave out prescriptions paid entirely outside those programs. Other claims databases have their own coverage. Gallup’s revised 2026 article reports in its text that 18% of current weight-loss users said they used a compounded or custom-mixed version. Surveys can capture channels outside insurance, but their questions, dates and populations also differ from claims studies; no single difference explains the gap.
If you're paying out of pocket, here's what GLP-1s cost without insurance, with prices by drug.
Which GLP-1 number should you use?
Match the number to the sentence you're writing. A share of people needs a survey or a patient-level source. A state ranking needs one source measured the same way in every state. A prescription count needs claims data, and it should be called a prescription count.
| If you want to write… | Use | What it counts | Period |
|---|---|---|---|
| "About X% of U.S. adults take a GLP-1" | KFF (any reason) or Gallup (weight loss) | Self-reported current use | Late 2025; mid-2026 |
| "[State] ranks high on a GLP-1 prescription measure" | Table 1, naming the government measure | Reported Medicaid prescriptions per enrollee or Medicare claim share—not population use | 2025; 2024 |
| "Medicaid filled X GLP-1 prescriptions in [state]" | Table 5 (CMS State Drug Utilization Data) | Prescriptions, including refills | 2025 |
| "X% of [state] residents currently take a GLP-1" | These sources do not establish that percentage. Do not replace it with a national survey or a prescription rank | No verified all-resident state estimate in this release | — |
| "Among adults who qualify, prescribing varies by state" | Epic Cosmos study | Share of eligible adults with an order | July 2021–Oct. 2025 |
| "Medicare GLP-1 claims in [state]" | Our Medicare state analysis | Part D claims by prescriber location | 2024 |
| "Among adults with diabetes, X% use a GLP-1" | CDC National Center for Health Statistics | Self-reported injectable use | 2024 |
Source: The RX Index. Checked Sept. 29, 2026.
Four questions to ask about any state GLP-1 number
People or prescriptions? A prescription count includes refills. In a simple example, one person picking up one prescription each month for a full year adds 12 prescriptions.
Who's counted? Medicaid enrollees, Medicare members, one company's insured patients and survey respondents are different groups.
Where is "the state"? Medicaid uses the patient's program. Medicare uses the prescriber's office.
What year? A 2026 article can carry 2024 data. Use the period printed beside the number.
Why does this matter now?
2025 is the last full year before these Medicaid policy changes. California, New Hampshire and Pennsylvania ended coverage when GLP-1s are used only for weight loss on Jan. 1, 2026. Massachusetts followed on July 3, 2026. Rhode Island’s notice schedules its change for Oct. 1, 2026, still ahead of this page’s Sept. 29 check. The notices preserve other medical-use routes and require medical-necessity review for members younger than 21 where applicable; these are not blanket bans on every GLP-1 use.
Medicare changed, too. The Medicare GLP-1 Bridge, which lets eligible Part D members get certain GLP-1s for weight management at a $50 monthly copay, began July 1, 2026. Its payments run outside Part D. Future Part D claim totals alone therefore will not measure Bridge use. The 2025 Medicaid figures provide a pre-change comparison for Medicaid, not a Bridge baseline.
If you're sorting out your own GLP-1 options where you live, Find My GLP-1 Path is our free starting point. It asks about your insurance, budget and goals, and takes about two minutes.
How we built this
Medicaid. On Sept. 29, 2026, we queried CMS State Drug Utilization Data for 2025 and 2024. We selected product names beginning with OZEMPIC, WEGOVY, MOUNJARO, ZEPBOUND, TRULICITY, VICTOZA, RYBELSUS, SAXENDA, BYDUREON, BYETTA, LIRAGL or EXEN. That includes generic liraglutide and exenatide. We left out insulin combination products (Soliqua and Xultophy), matching our Medicare analysis. Tirzepatide (Mounjaro, Zepbound) is included; it acts on GIP and GLP-1 receptors. We combined fee-for-service and managed-care reports, summed available prescriptions by state and quarter, and summed available reimbursement by state. Missing or suppressed cells were not estimated.
Enrollment. We averaged each state’s 12 final monthly CMS Medicaid enrollment reports for January–December 2025. The denominator excludes CHIP. Rate = annual reported prescriptions ÷ average monthly enrollment × 1,000. The adult-denominator calculation keeps the same all-age prescriptions. We use the exact annual sums divided by 12 for every rate; the table rounds enrollment only for display.
Checks. All 50 states and DC have reports for all four 2025 quarters and all 12 enrollment months. Available state and DC prescriptions sum to 11,193,556. Adding Puerto Rico’s 48,732 gives 11,242,288, compared with 11,255,460 in CMS’s separately published national rows. The gap is 13,172, about 0.12%. CMS applies primary and secondary suppression; these aggregates do not reveal the exact number of hidden prescriptions. We keep the national and state sums separate. The national 2024 total is 8,351,254.
Reimbursement. The 2025 national total_amount_reimbursed sum is $12,046,462,612.08, before Medicaid rebates. This CMS field includes Medicaid and non-Medicaid payment amounts for the reported prescriptions. It is not net Medicaid spending or patient out-of-pocket cost.
Medicare. We read CMS’s national 2024 product rows for claims, standardized 30-day fills and beneficiaries, plus its state Ozempic rows. There are 11 included product rows, not 11 distinct brands. For the all-drug state claim-share column, we rechecked the exact numerators and denominators in our published Medicare dataset, v1.1.0, and recomputed the percentages and ranks. This audit did not rebuild that state panel from the full raw CMS file. A beneficiary can appear under more than one product, so dividing 21,825,833 claims by 4,166,903 summed product-level beneficiaries gives a lower bound on average claims per distinct user: 5.237902826, or at least 5.2 to one decimal place.
The map audit. We checked all 50 counts and percentages printed by GLP-1 Newsroom against its page, then divided its stated counts by Census July 1, 2024 population, Vintage 2024. The publisher’s underlying Purple Lab extract was unavailable. Its counts are retained only to audit the published claim, with that status in the CSV. We then divided the unrounded per-resident ratios by the fixed assumptions 5.24 and 3 for the scenarios. Neither assumption is a verified refill pace for the map’s population.
Rankings. Ranks run highest to lowest using exact ratios before rounding. DC has no publisher-map count, so that column ranks 50 states. The Spearman rank correlations use the same 50 states and exclude DC. The top-10 overlap compares lists; it is not an index of treatment need or population use.
Published studies and surveys. We read the original reports and their definitions. We did not reanalyze their individual records. Kentucky’s fiscal-year beneficiary count remains a spokesperson’s figure as reported by the Kentucky Lantern. KSU’s state percentages remain published survey results; the yes-answer examples are unweighted illustrations, not extracted respondent counts.
Reproduce it. The state CSV contains the exact inputs for its rates, ranks, quarterly changes and map scenarios. The companion files add the national Medicaid totals, all 11 Medicare product rows, source links, chart data, a field dictionary and calculation formulas. The download bundle also identifies which inputs were read from CMS, which came from our published Medicare panel, and which merely document a publisher’s claim. Round only the final display value.
What does this data show, and what doesn't it?
It shows reported Medicaid prescription rates, Medicare claim shares, their differences across states, and a separate check of the arithmetic behind a publisher’s map. Repeat prescriptions and distinct people are different measures.
It does not establish current GLP-1 use among every state’s residents. Real Chemistry and Epic Cosmos supply results for defined patient groups; they do not fill that population-wide gap. The scenario calculator is not a prevalence estimate.
The CMS prescription tables do not separate diabetes from weight loss. Real Chemistry’s obesity-focused analysis uses diagnosis restrictions for some products, and Epic Cosmos excludes adults with type 2 diabetes. Those scopes stay separate.
The Medicaid and Medicare figures omit prescriptions paid outside those programs. Other claims sources have different coverage. Surveys ask people about use instead of relying on these program records.
Each measure covers its own group. Medicaid follows the reporting program. Medicare follows the prescriber’s office, not the patient’s home. Average monthly enrollment is not a count of distinct annual patients. The adult-denominator column is not an adult-only prescribing rate.
Reimbursement includes Medicaid and non-Medicaid payments before Medicaid rebates. CMS suppresses counts under 11 and some additional cells; the public totals are not a complete census of every prescription. We do not reconstruct suppressed values.
Timing is not proof. When prescriptions move in the same quarter as a policy change, that’s worth noticing, but it doesn’t show the policy caused it.
How to cite this page
Coziar, Kaden. "GLP-1 Usage by State: 2025 Medicaid Rates Vary 9.3-Fold." The RX Index Research. Updated September 29, 2026. https://therxindex.com/research/glp-1-usage-by-state/
For a single number, keep the measure and period with it. For example: "Pennsylvania reported 304.0 Medicaid GLP-1 prescriptions per 1,000 average monthly enrollees in 2025, according to The RX Index’s analysis of CMS data. Prescriptions include refills, not distinct patients."
Reuse: The RX Index’s original wording, table structure, chart design and calculations are available under CC BY 4.0, with credit to The RX Index. Underlying data, quotations and third-party figures keep their source attribution and terms; this note does not license them. No link is required.
Download the data
The GLP-1 State Use Crosswalk is free to download, no form: glp1-usage-by-state-2026.csv. It has 51 rows and 37 columns, including quarterly 2025 Medicaid counts, exact enrollment sums, Medicare claim-share inputs, Ozempic claims per beneficiary, and the two clearly labeled map scenarios.
The complete data and chart bundle adds the source register, field dictionary, national totals, Medicare product rows, chart inputs, published benchmark figures and calculation formulas. Chart images are available in PNG and SVG. No raw respondent data is included.
Source codes: S1 CMS State Drug Utilization Data (2025, 2024); S2 CMS Medicaid enrollment (2025); S3 CMS Medicare Part D Prescribers by Geography and Drug (2024); S4 The RX Index’s published Medicare state dataset, v1.1.0; S5 GLP-1 Newsroom’s printed map claims, not a verified Purple Lab extract; S6 U.S. Census Bureau NST-EST2024-POP, Vintage 2024. Blank map fields for DC mean “not published,” not zero.
Frequently asked questions
What state has the most GLP-1 patients?
These sources do not establish a current all-resident patient-count leader. On the prescription measures in Table 1, Pennsylvania ranks first for reported 2025 Medicaid prescriptions per 1,000 average monthly enrollees (304.0); Alaska leads 2024 Medicare claim share (1.757%); California prescribers have the most 2024 Medicare GLP-1 claims (1,865,079). None of those is a count of distinct state residents using GLP-1s.
What percentage of people in my state take a GLP-1?
The sources in this release do not establish that percentage for every state’s residents. Nationally, KFF found 12% of U.S. adults reported current use in late 2025. The state studies cover particular patient groups, while Table 1 compares prescription measures. The calculator shows scenarios, not a replacement state-use estimate.
Is it true 1 in 4 Kentuckians take a GLP-1?
The map cited for that claim does not establish it. Its printed count divided by all Kentucky residents gives 22.0 prescriptions per 100 people, not a count of distinct users. The 4.2% scenario assumes 5.24 prescriptions per person; it is not Kentucky’s measured rate. The separate 76,195 Medicaid figure is a fiscal 2023–24 spokesperson statement reported by the Kentucky Lantern.
What states cover GLP-1s for weight loss?
It changes often, so check our GLP-1 Medicaid coverage tracker and the linked state notice for the relevant drug and reason for treatment. The dated notices above set obesity-only coverage changes for Jan. 1, 2026 in California, New Hampshire and Pennsylvania, July 3 in Massachusetts, and Oct. 1 in Rhode Island. Other medical uses and under-21 review rules can differ. Private plans set their own rules.
How many GLP-1 prescriptions did Medicaid pay for in 2025?
For the products included here, CMS’s national rows sum to 11.26 million prescriptions, up 35% from 8.35 million in 2024. The reported prescriptions have $12.0 billion in total reimbursement before Medicaid rebates, including Medicaid and non-Medicaid payments. The separately summed 50-state-and-DC prescriptions equal 158.2 per 1,000 average monthly enrollees. Source and reconciliation.
Is Ozempic use the same as GLP-1 use?
No. Ozempic is one brand of semaglutide. GLP-1 counts on this page also include Wegovy, Mounjaro, Zepbound, Trulicity and others. In the included CMS Medicare product rows, Ozempic was 47.7% of 2024 GLP-1 claims, so an Ozempic-only number covers about half the picture there.
Do these numbers include compounded or cash-pay GLP-1s?
The Medicaid and Medicare figures exclude prescriptions paid outside those programs. Private databases have their own coverage, so no blanket statement fits every claims source. Gallup’s revised 2026 article reports in its text that 18% of current weight-loss users used a compounded or custom-mixed medicine; that survey has a different population and measure.
Can I call these 2026 numbers?
Use the period printed beside each number. The Medicaid data cover 2025, the Medicare and claims data cover 2024, and the surveys range from 2024 to mid-2026. A 2026 update date doesn't turn older data into 2026 data.
How often is this updated?
When CMS posts new Medicaid quarters or a new annual Medicare file, and when a cited survey is revised. Each update keeps this URL, records the check date and adds a note on what changed.
Sources
- Centers for Medicare & Medicaid Services, State Drug Utilization Data 2025 (data.medicaid.gov dataset 158a1baa-5506-400a-8ec3-97756f0b0536) and State Drug Utilization Data 2024 (dataset 61729e5a-7aa8-448c-8903-ba3e0cd0ea3c). Checked Sept. 29, 2026.
- Centers for Medicare & Medicaid Services, Medicaid and CHIP Performance Indicator enrollment data (data.medicaid.gov dataset 6165f45b-ca93-5bb5-9d06-db29c692a360), January–December 2025 final reports. Checked Sept. 29, 2026.
- Centers for Medicare & Medicaid Services, Medicare Part D Prescribers — by Geography and Drug, data year 2024, May 2026 release. Checked Sept. 29, 2026.
- The RX Index, Medicare GLP-1 Prescriptions by State, dataset v1.1.0. Checked Sept. 29, 2026.
- U.S. Census Bureau, Annual Estimates of the Resident Population, NST-EST2024-POP (December 2024). Checked Sept. 29, 2026.
- GLP-1 Newsroom, The GLP-1 Map (May 11, 2025; updated May 19, 2025), attributing its counts to Purple Lab. Publisher text checked Sept. 29, 2026; underlying extract unavailable.
- Fox News, America's fattest states revealed (Nov. 9, 2025). Checked Sept. 29, 2026.
- Kentucky Health News via The State-Journal, oral GLP-1 options could increase access to obesity treatment (Dec. 31, 2025). Checked Sept. 29, 2026.
- Kentucky Lantern, As diabetes drives up Kentuckians' use of weight-loss drugs (Feb. 25, 2025). Checked Sept. 29, 2026.
- Real Chemistry, U.S. Obesity Market Analysis: Exploring Demographic & Geographic Disparities in GLP-1 Use (Oct. 28, 2024). Checked Sept. 29, 2026.
- Jian X, Kang B, Zhang B, et al. Geographic variation in eligibility and uptake of GLP-1 receptor agonists for obesity in US adults. American Journal of Preventive Cardiology. 2026;29:101653. Checked Sept. 29, 2026.
- FAIR Health, Use of GLP-1 Drugs to Treat Overweight or Obesity Increased 587 Percent from 2019 to 2024 (May 27, 2025). Checked Sept. 29, 2026.
- Kansas State University, Meat Demand Monitor: Feb. 2020–Dec. 2025 Summary Report (issued February 2026). Checked Sept. 29, 2026.
- KFF, KFF Health Tracking Poll: Prescription Drug Costs, Views on Trump Administration Actions, and GLP-1 Use (Nov. 14, 2025). Checked Sept. 29, 2026.
- KFF, KFF Health Tracking Poll May 2024: The Public's Use and Views of GLP-1 Drugs. Checked Sept. 29, 2026.
- Gallup, In U.S., GLP-1 Usage Reaches New High (July 7, 2026; updated Sept. 8, 2026). Checked Sept. 29, 2026.
- CDC National Center for Health Statistics, GLP-1 Injectable Use Among Adults With Diagnosed Diabetes: United States, 2024, Data Brief No. 537 (August 2025). Checked Sept. 29, 2026.
- The RX Index, GLP-1 Medicaid Coverage by State, release 2026-09-28-review-1. Checked Sept. 29, 2026.
- Centers for Medicare & Medicaid Services, Medicare GLP-1 Bridge. CMS page checked directly Sept. 29, 2026.
- CMS, State Drug Utilization Data suppression FAQ. Checked Sept. 29, 2026.
- North Carolina Medicaid, coverage-change notice, Sept. 5, 2025. Checked Sept. 29, 2026.
- North Carolina Medicaid, coverage restored effective Dec. 12, 2025; notice Dec. 19. Checked Sept. 29, 2026.
- TennCare / Optum Rx, obesity-management notice effective Aug. 1, 2025. Checked Sept. 29, 2026.
- MO HealthNet, obesity-drug criteria: first implementation Jan. 9, 2025; revision Apr. 23, 2026. Checked Sept. 29, 2026.
- Medi-Cal Rx, obesity-only coverage change effective Jan. 1, 2026. Checked Sept. 29, 2026.
- New Hampshire Medicaid / Prime Therapeutics, Oct. 9, 2025 notice for Jan. 1, 2026. Checked Sept. 29, 2026.
- Pennsylvania DHS, Medical Assistance Bulletin 2025112402, effective Jan. 1, 2026. Checked Sept. 29, 2026.
- MassHealth, Pharmacy Facts 276, corrected May 13, 2026; effective July 3, 2026. Checked Sept. 29, 2026.
- Rhode Island EOHHS, Aug. 5, 2026 notice for Oct. 1, 2026. Checked Sept. 29, 2026.
- CMS, definition of total, Medicaid and non-Medicaid reimbursement in State Drug Utilization Data. Checked Sept. 29, 2026.