GLP-1 Bone Density and Fracture Risk: 15 Study Reports by Drug
By Kaden Coziar, Founder & Managing Editor, The RX Index Research · Updated September 2026
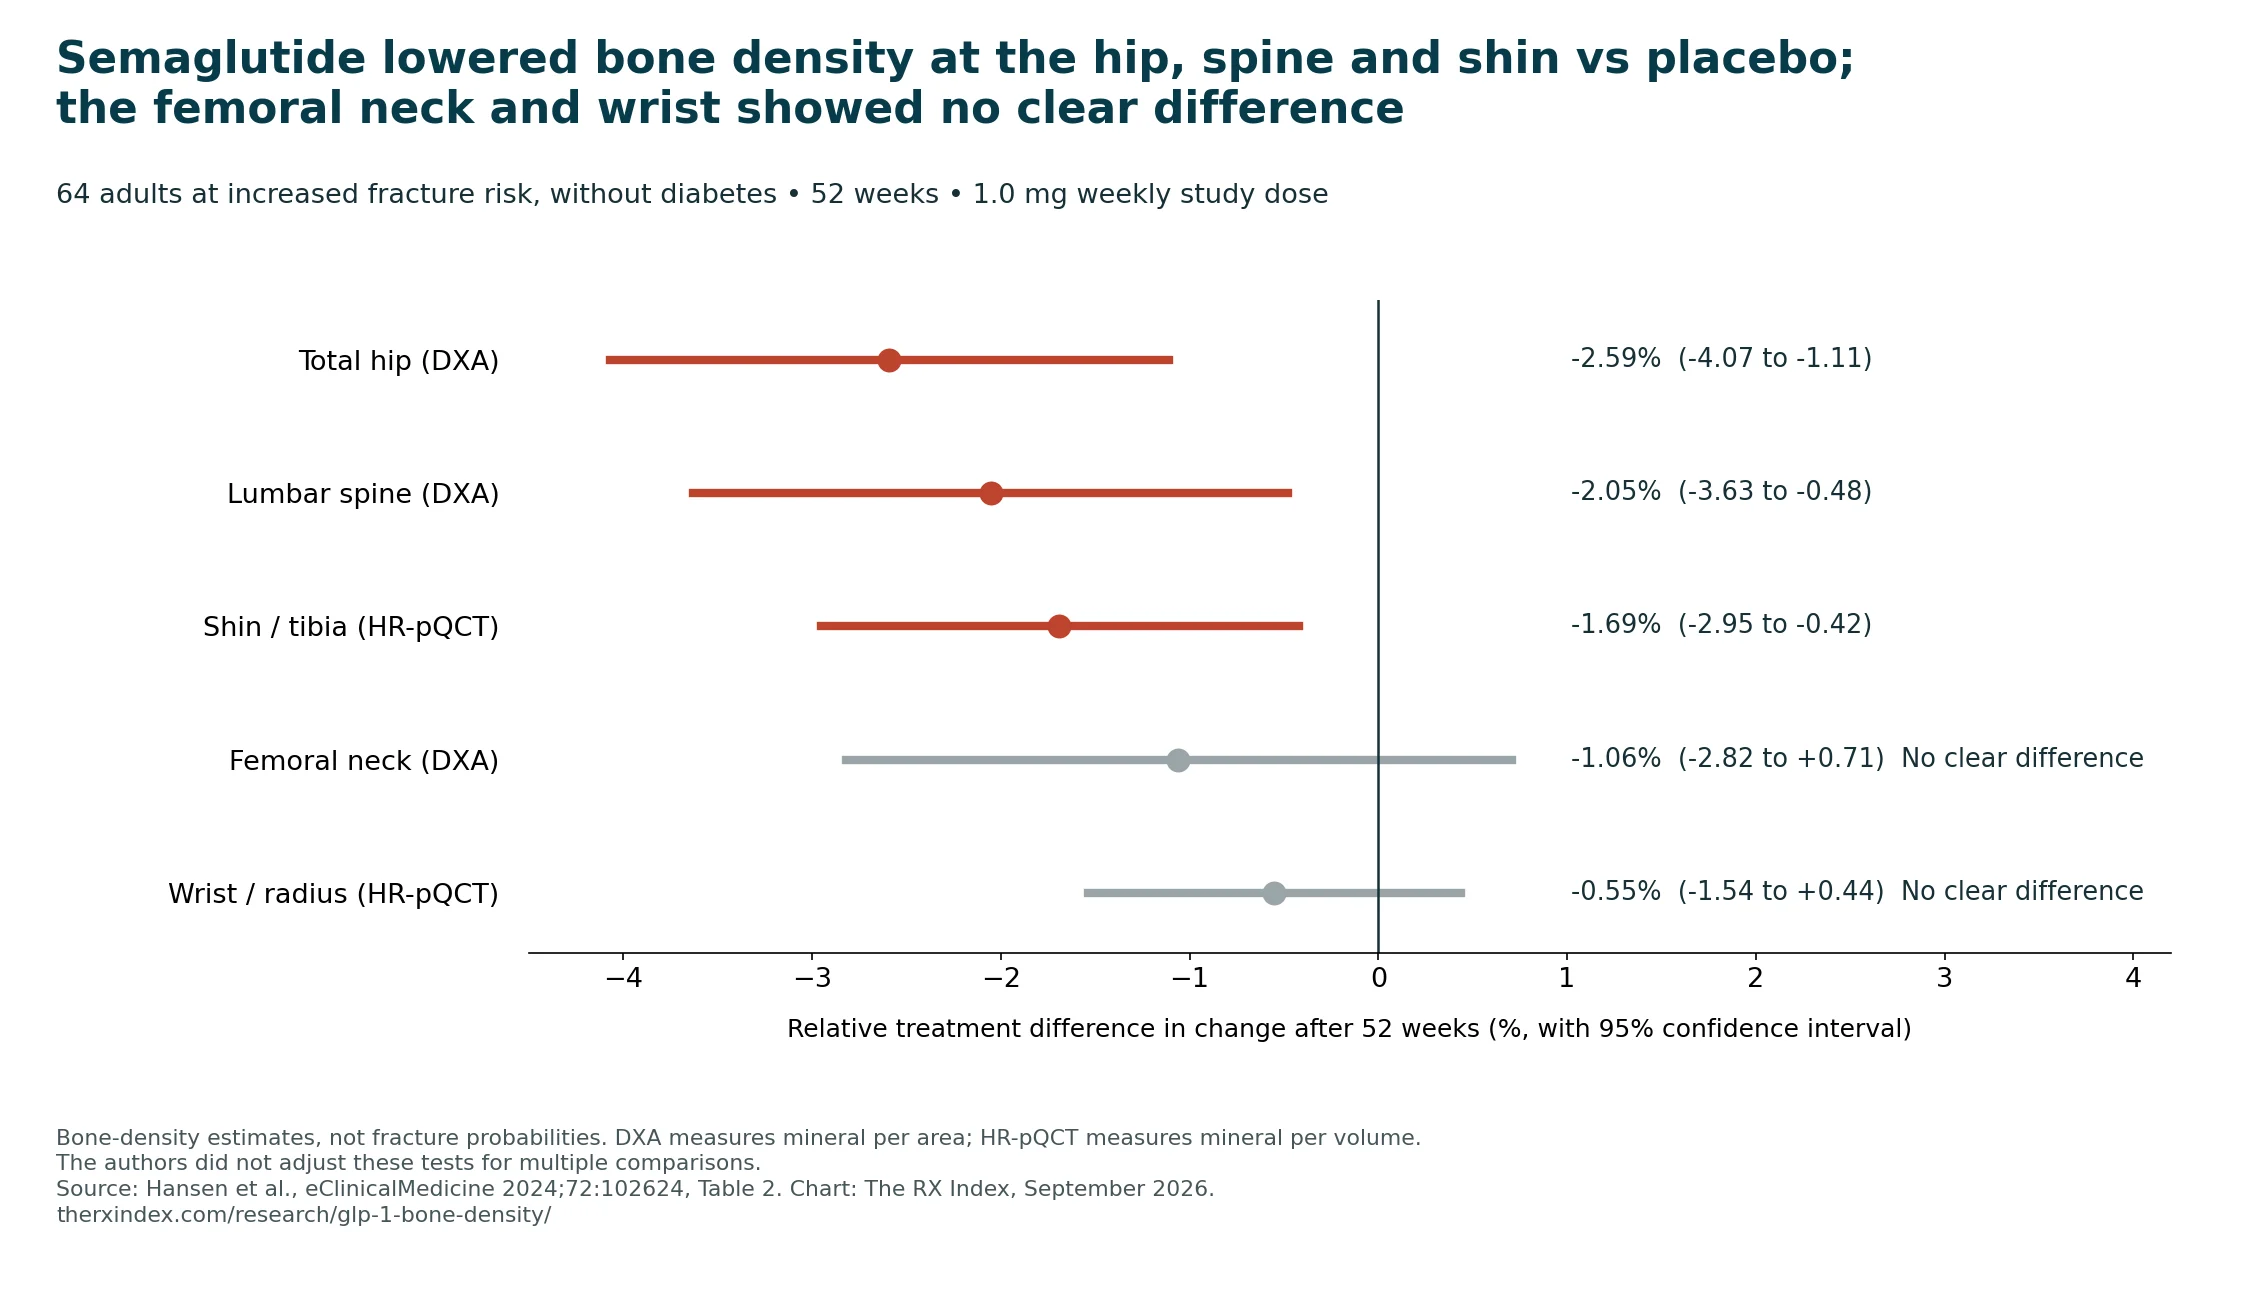
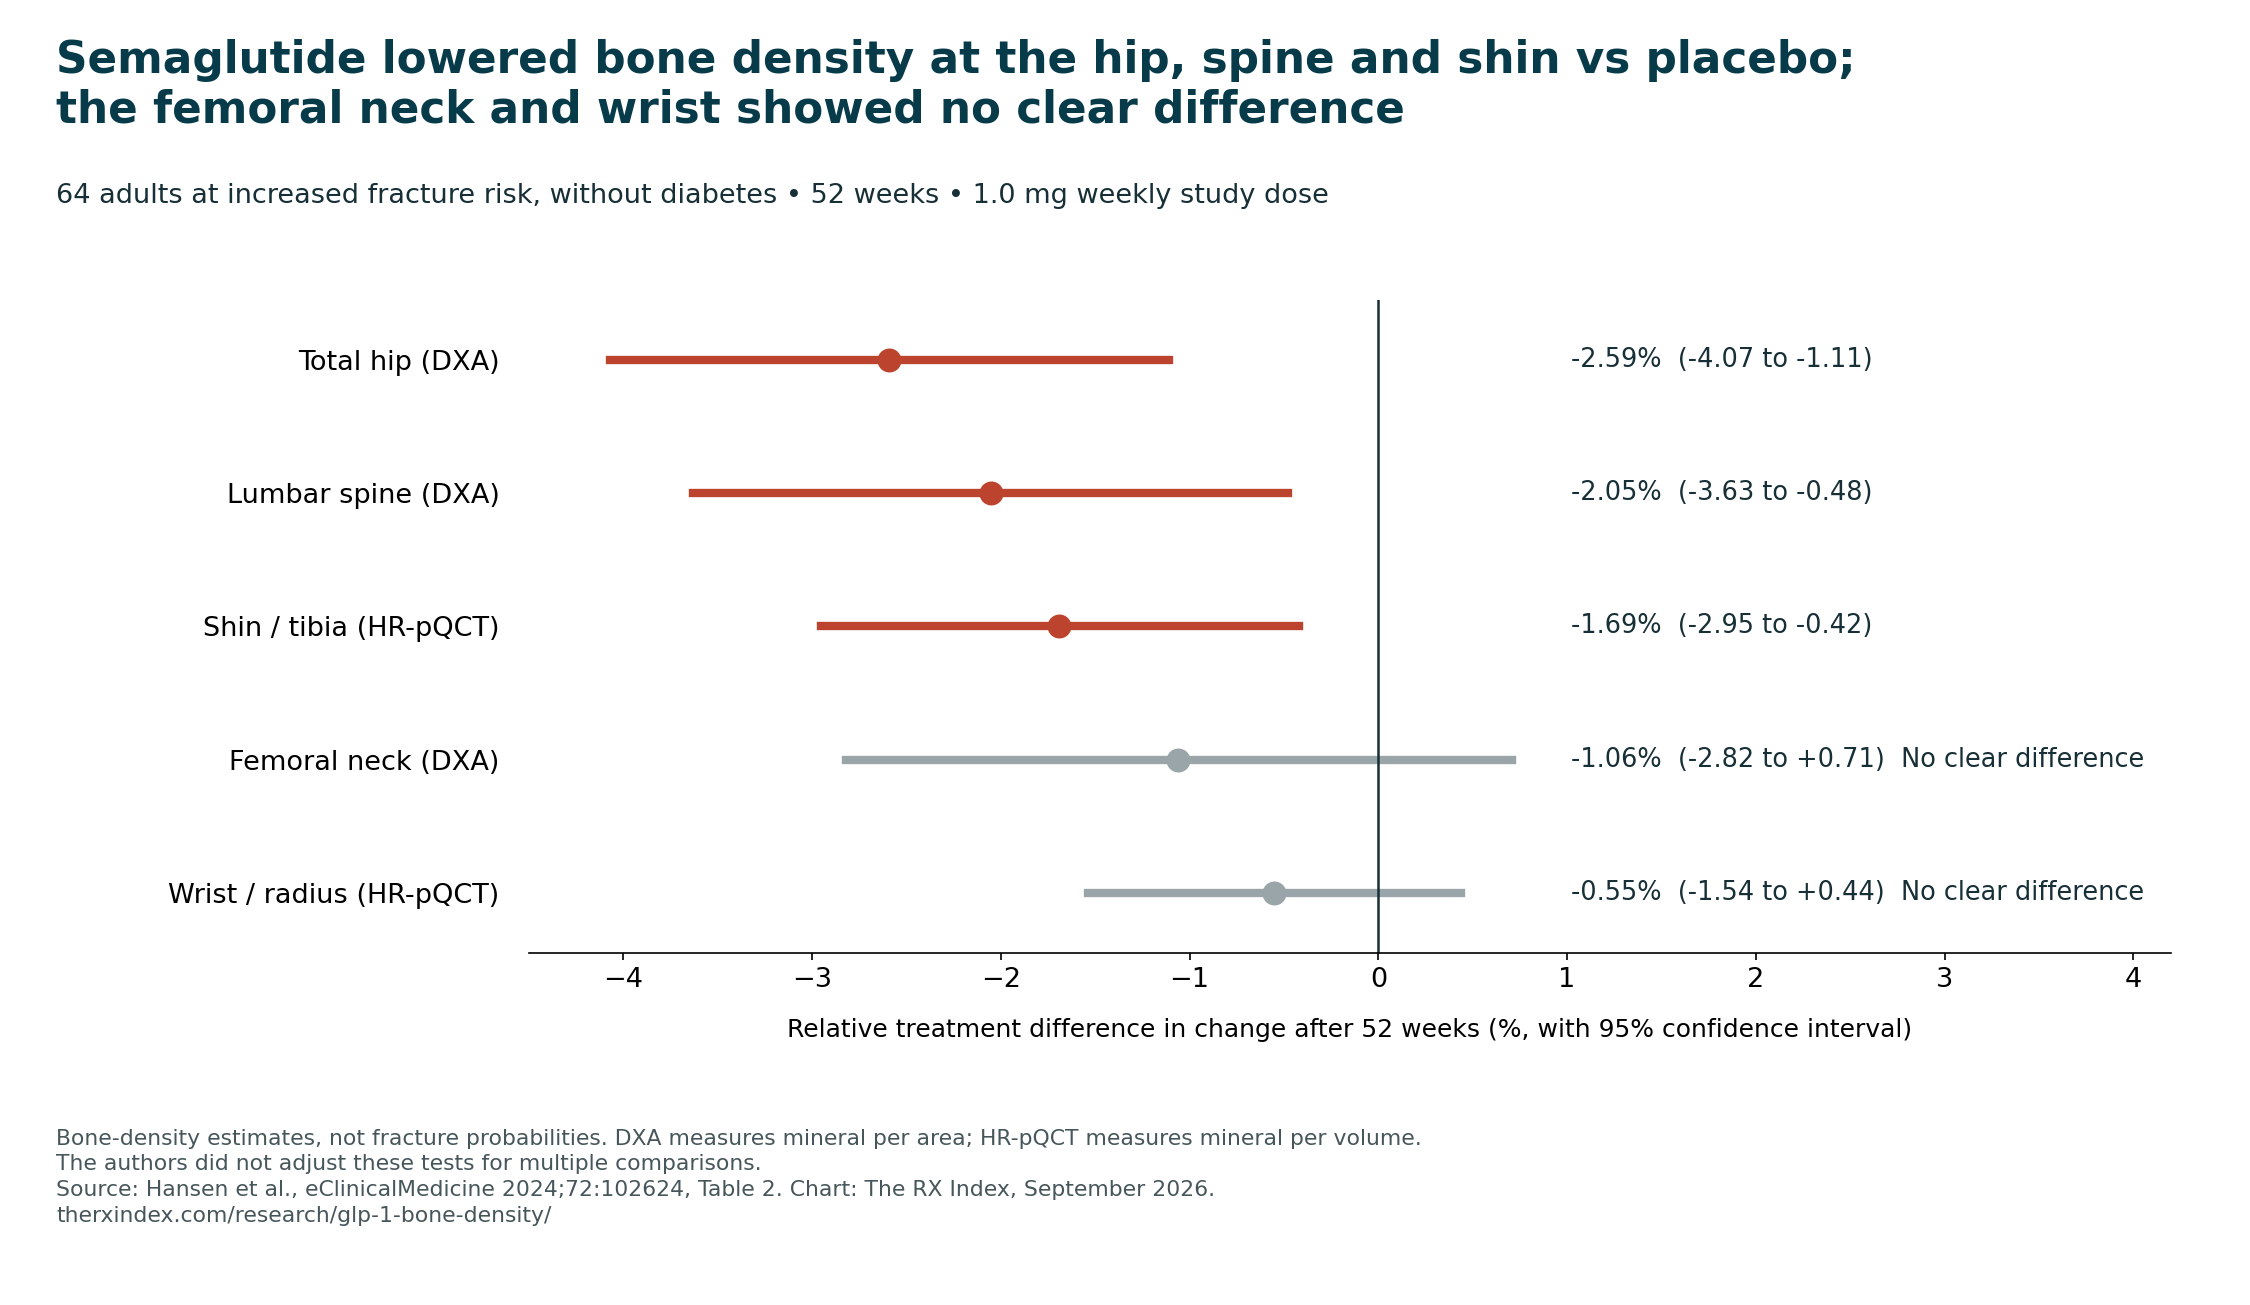
In a 52-week trial of 64 adults at increased fracture risk and without diabetes, semaglutide left hip bone density 2.6% lower relative to placebo (Hansen et al., 2024). That is not a 2.6% fracture risk. The RX Index’s September 2026 GLP-1 bone density map separates 15 study reports by drug, outcome and population.
Below: the drugs in this map, what six U.S. labels say about fractures, and the exact counts behind the older-adult findings.
Key GLP-1 bone density statistics
- Semaglutide left hip bone density 2.59% lower and spine bone density 2.05% lower relative to placebo after 52 weeks in 64 adults at increased fracture risk and without diabetes (Hansen et al., eClinicalMedicine, 2024, 1.0 mg study dose).
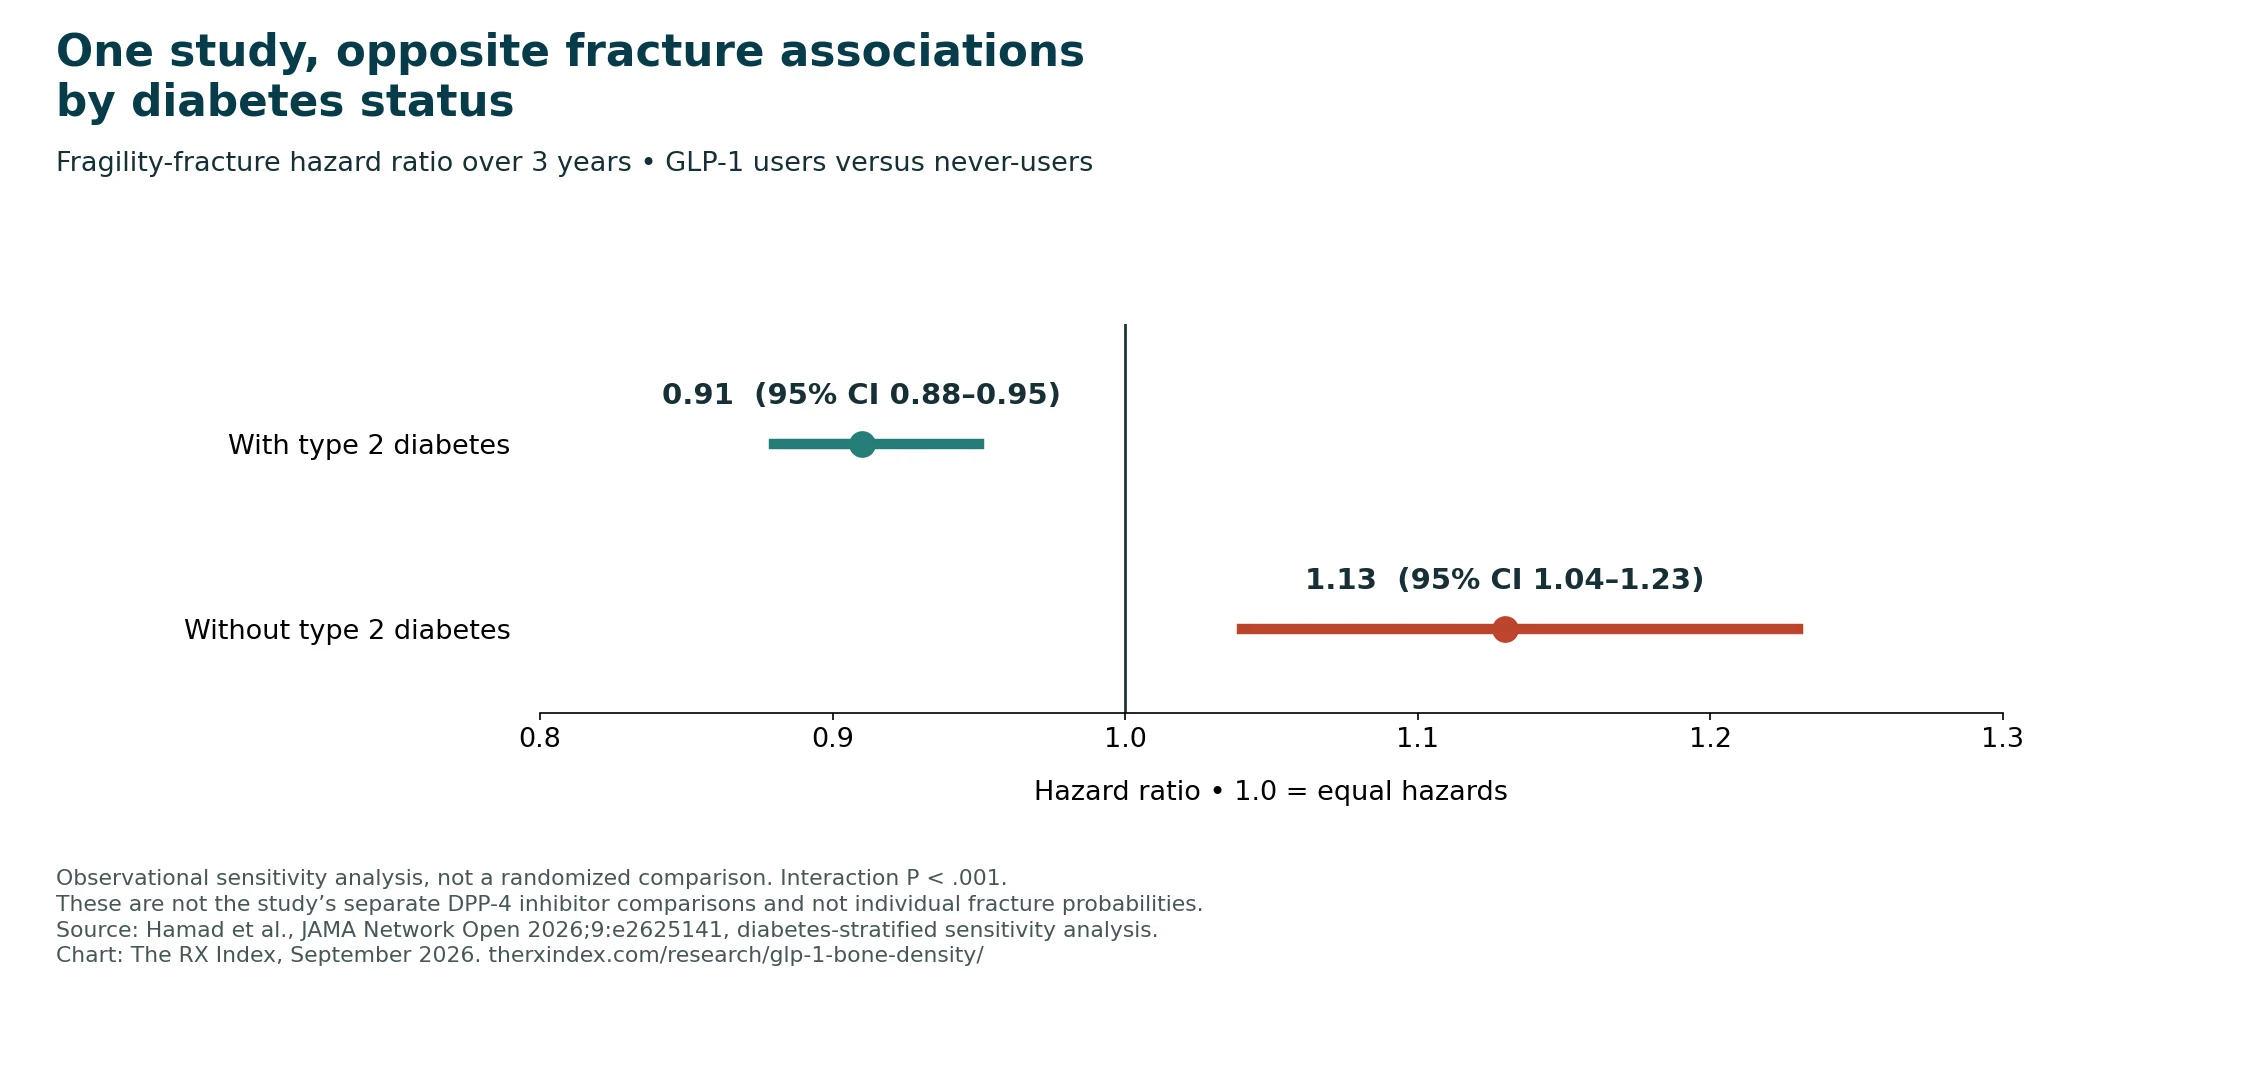
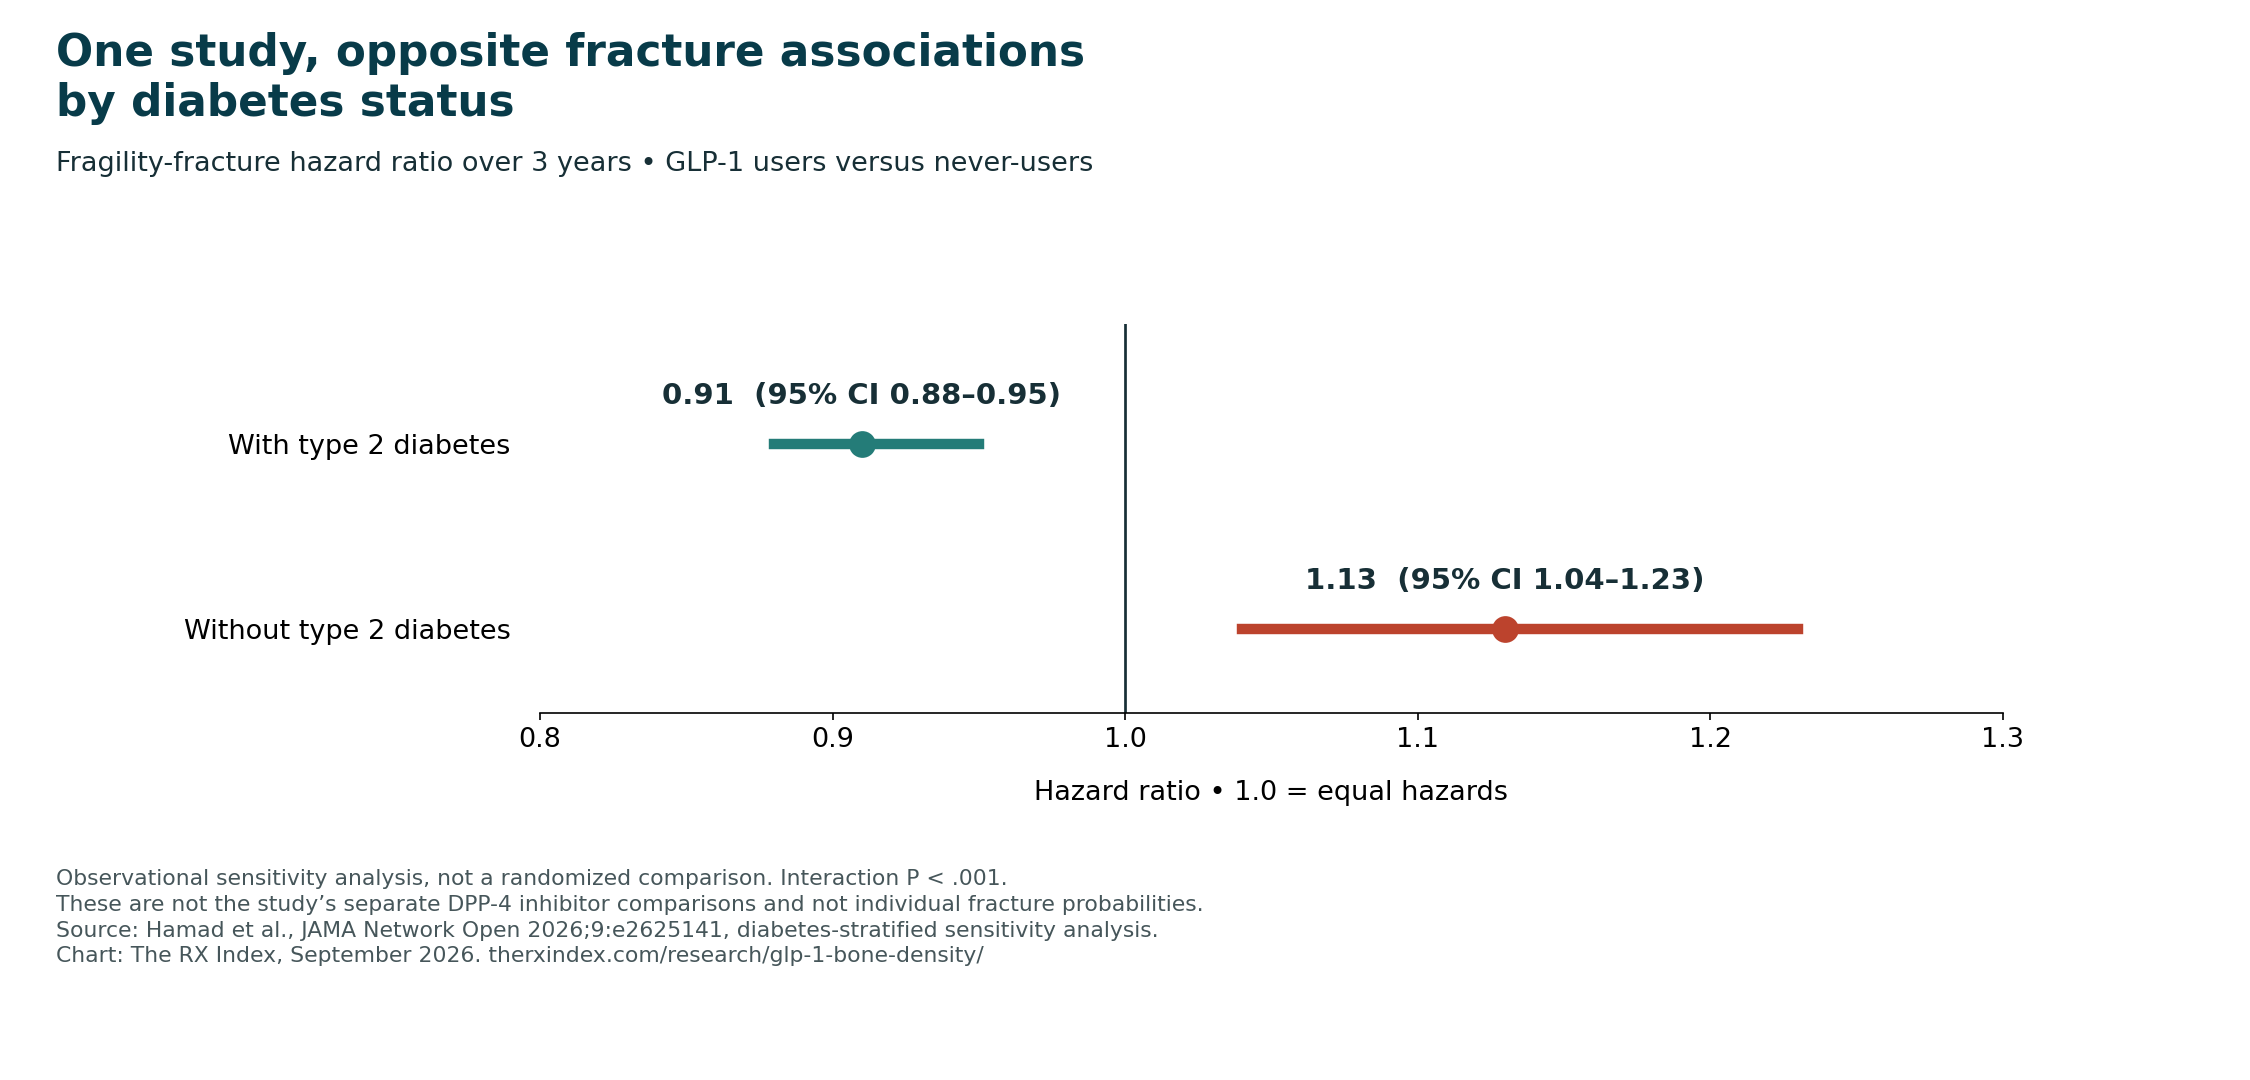
- One three-year health-record analysis found opposite fracture associations by diabetes status: HR 0.91 with type 2 diabetes and HR 1.13 without it. Both compared GLP-1 users with people who had never used a GLP-1—not DPP-4 inhibitor users (Hamad et al., JAMA Network Open, 2026).
- A 52-week liraglutide trial in 37 women after diet-induced weight loss reported less bone mineral content loss than the control group: an estimated difference of 27 g (95% CI 5–48). Bone mineral content is not bone density or fracture risk (Iepsen et al., Journal of Clinical Endocrinology & Metabolism, 2015).
- In Wegovy's heart trial (SELECT), 24.2 people per 1,000 at age 75 or older had a hip or pelvis fracture on semaglutide vs 6.0 per 1,000 on placebo over the trial, or about 18 more per 1,000—not per year (The RX Index calculation from participant counts in the Wegovy prescribing information, rev. 06/2026; overall median follow-up 41.8 months).
- In the same trial, 9.8 women per 1,000 had a hip or pelvis fracture on semaglutide vs 2.1 per 1,000 on placebo over the trial, about 8 more per 1,000 (The RX Index calculation from participant counts in the Wegovy label).
- Across all 17,604 people in SELECT, reported fracture adverse events in the broader coding group were 3.5% on semaglutide vs 3.6% on placebo over a mean of 39.8 months. The trial did not systematically collect every nonserious fracture (Kushner et al., Obesity, 2025).
- Only 1 of the 6 U.S. prescribing-information documents reviewed here contains a clinical fracture finding: Wegovy's. No such statement was found in the checked Ozempic, Mounjaro, Zepbound, Saxenda or Foundayo editions (The RX Index label review, September 29, 2026).
- In 133,606 adults with type 2 diabetes, starting a GLP-1 was linked to a 21% lower fragility-fracture hazard over 3 years than starting a DPP-4 inhibitor (HR 0.79) and a 30% lower hip or femur fracture hazard (HR 0.70) (Hamad et al., JAMA Network Open, 2026).
- In adults 65 and older with type 2 diabetes, femoral (thigh-bone) fractures in one year were 2.5 per 1,000 on semaglutide vs 5.2 per 1,000 on DPP-4 inhibitors, and 1.9 vs 4.4 per 1,000 on tirzepatide vs DPP-4 inhibitors (Chen et al., Osteoporosis International, 2026; per-1,000 math by The RX Index).
- In 46,177 adults 65 and older with type 2 diabetes in Israel, starting a GLP-1 was linked to an 11% higher fragility-fracture hazard than starting an SGLT-2 or DPP-4 inhibitor (HR 1.11) over a median of 34.7 months (Kasher Meron et al., Journal of Clinical Endocrinology & Metabolism, 2026).
- Starting tirzepatide was linked to a 44% higher 14-month hazard of new osteoporosis or fragility fracture, combined, than starting another GLP-1 (HR 1.44) in 66,329 matched pairs; that is not a fracture-only number (Hsu et al., Diabetes Research and Clinical Practice, 2025).
- A five-year conference study of 73,483 matched pairs with type 2 diabetes and obesity reported osteoporosis diagnoses in 4.1% vs 3.2%, about 41 vs 32 per 1,000. Its printed case counts do not reproduce those percentages using the full cohort sizes; the mismatch is shown below (AAOS 2026 abstract, Table 1; rounded-percentage conversion by The RX Index).
- As of September 29, 2026, The RX Index's targeted search found no randomized human trial reporting tirzepatide's effect on hip or spine bone density; a 2026 pooled analysis of seven tirzepatide trials says bone density wasn't assessed in them (Alfaris et al., Diabetes, Obesity and Metabolism, 2026).
On this page
- What do the studies show for each GLP-1 drug?
- Why do the results differ by diabetes status?
- Does Ozempic (semaglutide) lower bone density?
- How many fractures showed up in Wegovy's heart trial?
- Which GLP-1 labels mention fractures?
- What do tirzepatide (Zepbound, Mounjaro) studies show?
- Are older adults at higher risk?
- Does exercise protect your bones on a GLP-1?
- Where did the "30% higher osteoporosis risk" headline come from?
- What should you ask your doctor?
- Why this matters now
- How we built this
- What this data does and doesn't show
- How to cite this page
- Download the data
- Frequently asked questions
- Sources
What do the studies show for each GLP-1 drug?
Semaglutide has the most bone evidence in this map: one randomized trial found 2.59% lower hip bone density relative to placebo after a year, and its big heart trial reported more hip and pelvis fractures in women and people 75 and older. Tirzepatide has fracture data from health records but no randomized human hip or spine bone-density result we could find. Only Wegovy's label, among the six checked here, contains a clinical fracture finding. Sources are linked in Table 1.
Read each row with one question in mind: did the study measure bone density, an osteoporosis diagnosis, or actual broken bones? Those are three different things. Bone density can drop without a single extra fracture showing up, at least over the time a study runs.
| Drug (brands) | Bone density | Fractures | What the U.S. label says | Biggest gap |
|---|---|---|---|---|
| Semaglutide (Ozempic, Wegovy) | 1.0 mg for 52 weeks: hip −2.59%, spine −2.05% relative to placebo (64 adults at increased fracture risk, no diabetes; Hansen) | Heart trial: reported fracture adverse events 3.5% vs 3.6%, with higher hip/pelvis proportions in women and age 75+ (SELECT, label). Diabetes cohorts report lower femoral or major osteoporotic fracture associations in some comparisons (Chen, Huang) | Wegovy: yes, lists hip and pelvis fracture counts. Ozempic: no clinical fracture statement found | The bone-density trial in this map used the 1.0 mg dose, not the 2.4 mg Wegovy dose |
| Tirzepatide (Mounjaro, Zepbound) | No randomized human hip/spine BMD result located; pooled phase 3 trials did not assess BMD (Alfaris) | Age 65+ with diabetes: lower femoral-fracture association vs DPP-4 inhibitors (Chen). Vs other GLP-1s: higher osteoporosis-or-fracture composite (HR 1.44; Hsu). Pooled trial counts are descriptive, not proof of equal risk | Neither reviewed label contains a clinical fracture statement | Bone density not assessed in the pooled phase 3 trials |
| Liraglutide (Saxenda) | 3.0 mg: hip −0.013 g/cm² vs placebo; exercise combination had no clear hip/spine difference from placebo. Whole-body BMD favored liraglutide and the combination (Jensen); a separate 1.2 mg trial reported less BMC loss (Iepsen) | Diabetes-treatment trial subgroup: fracture OR 0.56 (Cheng). No fragility fractures were reported in the 195-person exercise study; it was not powered for fracture prevention | No clinical fracture statement found | A weight-management trial large enough to establish fracture risk |
| Orforglipron (Foundayo) | No qualifying human result located in the targeted search | No qualifying human fracture-outcome report located | No clinical fracture statement found in the reviewed label | Human BMD and clinical fracture outcomes |
| GLP-1s as a group | Mixed-drug cohort: hip loss similar overall; more loss without diabetes (Liu) | Findings differ by population, comparator and fracture type (see next section) | — | Direct, aligned comparisons between drugs |
Source: The RX Index GLP-1 Bone Evidence Map v1.1, built from Hansen 2024, Jensen 2024, Kushner 2025, Hamad 2026, Huang 2026, Chen 2026, Hsu 2025, Liu 2026, Cheng 2019, Alfaris 2026, Iepsen 2015 and six U.S. prescribing-information documents. Full rows with links are in the dataset.
What the words mean
| Term | Plain meaning |
|---|---|
| Bone mineral density (BMD) | Mineral measured per scanned area (DXA) or volume (3D imaging). It is one measure of bone strength, not a fracture count. |
| Bone mineral content (BMC) | The amount of bone mineral measured, usually in grams. BMC and BMD are not the same measurement. |
| DXA scan | The standard low-dose X-ray that measures BMD at the hip and spine. |
| HR-pQCT | A 3D X-ray of the shin or wrist that shows bone structure in more detail. |
| Osteoporosis | A diagnosis of bones thin enough to break easily. In health-record studies it can mean a diagnosis code or a prescription for a bone drug. |
| Fragility fracture | A break from a fall from standing height or less. |
| Placebo | A dummy shot with no drug in it, used for comparison. |
| Hazard ratio (HR) | Compares how quickly an event occurs during follow-up. 1.0 means equal hazards; 0.79 means about 21% lower and 1.44 about 44% higher. It is not the percentage of people affected. |
| 95% confidence interval | Shows the uncertainty around an estimate under the study’s methods. A ratio interval that includes 1.0, or a difference interval that includes 0, includes “no difference.” Tests adjusted for many comparisons can need a stricter threshold. |
| Composite outcome | Two or more outcomes counted together, like "osteoporosis or fracture." |
Source: definitions written by The RX Index for this page.
Look up a drug and an outcome
Use the full evidence table to find a drug and the kind of result you care about. Every row keeps its population, comparison, time period and source link. Nothing is ranked, and nothing is hidden: the full table and the CSV stay available without a form.
Why do the results differ by diabetes status?
In one three-year analysis, GLP-1 use was linked to a lower fragility-fracture hazard in people with type 2 diabetes (HR 0.91) but a higher hazard in people without it (HR 1.13). Both groups were compared with GLP-1 noninitiators (Hamad et al., 2026). That is a specific finding—not proof that diabetes determines what every GLP-1 does to bone.
Here's why the headlines keep fighting each other. One week a study says GLP-1s protect bones. The next week one says they hurt them. Check who was studied, what was measured and what the comparison was. Even one trial can report lower hip density and higher whole-body density.
| Group | Study | Type | Compared with | What it found | What the result does not establish |
|---|---|---|---|---|---|
| No diabetes | Hansen 2024, semaglutide | Randomized trial | Placebo | Hip −2.59%, spine −2.05% relative differences at 52 weeks | A fracture probability |
| No diabetes | Jensen 2024, liraglutide | Secondary analysis of randomized trial | Placebo | Hip −0.013 g/cm²; whole-body BMD favored liraglutide and the combination | One direction for every bone outcome |
| Weight-reduced women without diabetes | Iepsen 2015, liraglutide | Randomized trial | Weight maintenance without liraglutide | Less BMC loss; reported estimated difference 27 g (5–48) at 52 weeks | Better hip BMD or fewer fractures |
| No diabetes | SELECT, Kushner 2025 and Wegovy label | Randomized trial safety analysis | Placebo | Reported fracture adverse events 3.5% vs 3.6%; hip/pelvis proportions higher in women and age 75+ | Complete ascertainment of all nonserious fractures |
| No diabetes | Liu 2026, semaglutide or tirzepatide | Health records | Matched non-users | Hip −1.0% vs −0.6% per year | A drug-specific result |
| Without type 2 diabetes | Hamad 2026, GLP-1s | Health records, sensitivity analysis | GLP-1 never-users | Fragility-fracture HR 1.13 (1.04–1.23), 3 years | The main DPP-4 comparator result |
| Without type 2 diabetes | Huang 2026, semaglutide | Health records | Four separate weight-loss-drug/usual-care comparisons | No significant major osteoporotic fracture association over 2 years | Proof of identical risks |
| No diabetes; stable weight | Epic Research 2026, GLP-1s | Research brief using health records | Other weight-loss drugs, stable weight | Osteoporosis-record hazard 22.0% higher | A fracture count or an estimate for all weight-change groups |
| No diabetes | Constantine, online 2025 / issue 2026, GLP-1s | Health records | Matched non-users | Reported 1-year fracture proportions 3.05% vs 2.61%; reported RR 1.09 | The printed RR does not equal the crude proportion ratio; see source mismatch |
| Type 2 diabetes | Cheng 2019, GLP-1s | Meta-analysis of randomized trials | Placebo or other diabetes drugs | Fracture OR 0.71 (0.56–0.91) | A current obesity-dose drug ranking |
| Type 2 diabetes | Hamad 2026, GLP-1s | Health records, sensitivity analysis | GLP-1 never-users | Fragility-fracture HR 0.91 (0.88–0.95), 3 years | Proof that diabetes causes a protective drug effect |
| Type 2 diabetes | Huang 2026, semaglutide | Health records | Usual care: metformin without index/comparator initiation | Major osteoporotic fracture HR 0.84 (0.76–0.93), 3 years | The result of every comparator analysis |
| Type 2 diabetes, age 65+ | Chen 2026, semaglutide | Health records | DPP-4 inhibitor | Femoral-fracture HR 0.488 (0.367–0.649), 1 year | An estimate for all older adults, including those excluded for frailty or prior falls |
| Type 2 diabetes; stable weight | Epic Research 2026, GLP-1s | Research brief using health records | GLP-1 non-users, stable weight | Osteoporosis-record hazard 8.7% lower | A BMD or fracture outcome |
| Diabetes; type not specified in accessible abstract | Liu 2026, semaglutide or tirzepatide | Health records | Matched non-users | Hip BMD decline similar | Proven equivalence |
| Type 2 diabetes, age 65+ | Kasher Meron 2026, GLP-1s | Health records | SGLT-2 or DPP-4 inhibitor | Fragility-fracture HR 1.11 (1.01–1.21), median 34.7 months | The same population/comparator as Chen |
| Type 2 diabetes and obesity | AAOS 2026 abstract, GLP-1s | Conference study using health records | Matched non-users | Reported osteoporosis 4.1% vs 3.2%; RR 1.29 | A verified reconstruction from counts; see denominator mismatch |
Source: the linked original reports, checked September 29, 2026. This table keeps the outcome, group and comparator attached to each finding. Hsu's mixed-population drug comparison and Alfaris's pooled trial results appear in the tirzepatide section.
The no-diabetes evidence is not uniformly negative. Iepsen measured BMC, while Jensen found different results at different bone sites. Counting each whole study as “better” or “worse” would hide those findings.
The split inside the same studies
A count across different studies can mislead. The people differ, the drugs differ, the years differ. Looking inside one study helps, but the comparisons and follow-up still need to match. Four reports here present separate results by diabetes status.
| Study | People with diabetes | People without diabetes |
|---|---|---|
| Hamad 2026, fragility fractures over 3 years vs GLP-1 never-users | Type 2 diabetes: HR 0.91 (0.88–0.95) | Without type 2 diabetes: HR 1.13 (1.04–1.23) |
| Huang 2026, semaglutide, major osteoporotic fracture | Type 2 diabetes, 3 years: HR 0.69 vs empagliflozin, 0.72 vs glipizide, 0.84 vs usual care; sitagliptin comparison not significant after correction | Without type 2 diabetes, 2 years: no significant association in four different drug/usual-care comparisons |
| Liu 2026, annualized hip BMD change vs matched non-users | Diabetes type not specified in accessible abstract: decline similar to non-users | −1.0% vs −0.6% per year: greater decline (P=.04) |
| Epic Research 2026, osteoporosis record; weight change −2% to +2% | Type 2 diabetes: 8.7% lower relative hazard vs GLP-1 non-users | No diabetes: 22.0% higher relative hazard vs other weight-loss drugs |
Source: the four reports linked in the table, checked September 29, 2026. Hamad reports an interaction P<.001: evidence that the association differed by diabetes status in that analysis. That does not show why it differed. Epic's outcome includes a diagnosis or an osteoporosis-medicine order, not just scan-confirmed osteoporosis.
| Population and follow-up | Semaglutide compared with | Hazard ratio (95% CI) | Significant after correction for multiple tests? |
|---|---|---|---|
| Type 2 diabetes, 3 years | Empagliflozin | 0.69 (0.61–0.77) | Yes |
| Type 2 diabetes, 3 years | Glipizide | 0.72 (0.63–0.83) | Yes |
| Type 2 diabetes, 3 years | Usual care | 0.84 (0.76–0.93) | Yes |
| Type 2 diabetes, 3 years | Sitagliptin | 0.84 (0.70–0.99) | No: raw P=.045; adjusted P=.113 |
| Without type 2 diabetes, 2 years | Naltrexone/bupropion | 0.75 (0.46–1.22) | No |
| Without type 2 diabetes, 2 years | Phentermine/topiramate | 1.35 (0.81–2.25) | No |
| Without type 2 diabetes, 2 years | Phentermine | 1.13 (0.84–1.51) | No |
| Without type 2 diabetes, 2 years | Usual care | 0.93 (0.73–1.18) | No |
Source: Huang et al., Tables 1 and 2. “Usual care” means metformin users without starting semaglutide or a comparator drug. The correction is the paper's Benjamini–Hochberg false-discovery-rate procedure; the sitagliptin result shows why a confidence interval alone is not the full significance test here.
Hamad's main diabetes comparison against DPP-4 inhibitors also changed over time: the cumulative three-year HR was 0.79, but the third-year interval alone was 0.94 (0.86–1.02), with no clear difference. Those answer different time questions, not conflicting versions of one number (Hamad et al., interval analysis).
Why diabetes might change the answer
These studies do not prove that diabetes itself explains the differences. They point at three things.
The comparison is often different. Most diabetes studies here compare GLP-1 users with people on other diabetes drugs, like DPP-4 inhibitors, SGLT-2 inhibitors or glipizide. Most no-diabetes studies compare them with a placebo, with people on no drug, or with people on another weight-loss medicine. "Better than another diabetes pill" and "better than nothing" are different questions.
Weight loss may be doing more of the work without diabetes. In the Weill Cornell study, more weight loss went with more hip bone loss, and the authors concluded that weight loss seemed to drive bone loss in people without diabetes (Liu et al., 2026).
Something beyond weight and blood sugar may be at play in diabetes. In the JAMA Network Open study, a mediation model accounting for changes in BMI and A1c still estimated a lower fracture hazard (direct-effect HR 0.81, 0.76–0.86). That model does not prove a bone-protective mechanism (Hamad et al., 2026).
Does Ozempic (semaglutide) lower bone density?
Yes, in the 64-person trial of adults at increased fracture risk and without diabetes. After 52 weeks, semaglutide 1.0 mg left hip bone density 2.59% lower and spine bone density 2.05% lower relative to placebo, while the semaglutide group lost about 9% of its weight. The trial was not designed to estimate fracture risk (Hansen et al., 2024).
The semaglutide group’s average hip density went from 0.785 to 0.764 g/cm², about 2.7% down. The placebo average stayed at 0.793 g/cm². The study’s adjusted relative difference was 2.59%. That is a group comparison—not a prediction for one person’s bones.
| Measure | Relative treatment difference in change | 95% CI | Clear difference before any multiple-test correction? |
|---|---|---|---|
| Total hip bone density (DXA) | −2.59% | −4.07 to −1.11 | Yes |
| Lumbar spine bone density (DXA) | −2.05% | −3.63 to −0.48 | Yes |
| Shin (tibia) bone density (HR-pQCT) | −1.69% | −2.95 to −0.42 | Yes |
| Femoral neck bone density (DXA) | −1.06% | −2.82 to 0.71 | No |
| Wrist (radius) bone density (HR-pQCT) | −0.55% | −1.54 to 0.44 | No |
| CTX, a blood marker of bone breakdown | +54.8% | 17.5 to 92.1 | Yes |
| PINP, a blood marker of bone building | +17.3% | −9.0 to 43.6 | No |
| Body weight | −8.8% | −11.7 to −6.0 | Yes |
Source: Hansen et al., eClinicalMedicine 2024;72:102624, Table 2. 64 adults, 32 per group. PINP was the primary outcome; the other rows were secondary. The authors did not adjust these tests for multiple comparisons. The hip/spine DXA measures are mineral per area; the shin/wrist 3D measures are mineral per volume. They are not measurements of the same bone compartment.
The hip, spine and shin carry your body weight every time you stand. The wrist doesn't. The trial's authors pointed to that pattern: bones that suddenly carry less weight tend to rebuild less. It fits, though the femoral neck, also weight-bearing, didn't show a clear change.
Where the "2.6%" number comes from
That hip number gets repeated a lot. Here's who was actually in the trial.
- The dose was 1.0 mg. That's an Ozempic dose, not the 2.4 mg Wegovy dose.
- 64 people, 32 per group. Mean age 63. 86% were women past menopause.
- They started at increased fracture risk. Everyone had low bone density or a recent fragility fracture.
- Average BMI was 27.7. That is in the overweight range, not the obesity range.
- It's a gap between groups. Hip density in the semaglutide group went from 0.785 to 0.764 g/cm², about 2.7% down. The placebo group stayed at 0.793.
So "2.6% bone loss on GLP-1s" stretches one small trial across millions of very different people.
Is 54.8% a bone-loss number?
No. It's CTX, a blood marker that rises when the body breaks down more bone. Its relative treatment difference was +54.8%; the hip BMD difference was −2.59%. These are different measurements. Dividing one percentage by the other does not tell you how much worse the bone loss was.
Is that more bone loss than dieting would cause?
The cited diet trial found hip BMD fell 2.2% over one year in its calorie-restriction group, whose weight fell 10.7%; hip BMD rose 1.2% in the control group (Villareal et al., 2006). Those are within-group changes from a different trial. Hansen’s 2.59% is a relative treatment difference, so placing them side by side does not show that dieting and semaglutide cause the same bone loss. These studies did not match equal amounts of weight loss head to head.
Bone density and muscle are separate questions. For what GLP-1s do to lean tissue, see our GLP-1 lean mass loss by drug research.
How many fractures showed up in Wegovy's heart trial?
Across all 17,604 people in SELECT, reported fracture adverse events in the broader coding group were 3.5% on semaglutide 2.4 mg vs 3.6% on placebo over a mean of 39.8 months. Hip and pelvis fracture proportions were higher in two groups: 24.2 vs 6.0 per 1,000 at age 75+, and 9.8 vs 2.1 per 1,000 in women. Those are trial-period participant proportions, not yearly rates (SELECT safety paper, Wegovy label).
The subgroup counts come straight from the Wegovy label. Here they are in plain per-1,000 terms.
| Group | Semaglutide | Placebo | Per 1,000 (semaglutide vs placebo) | Difference per 1,000 |
|---|---|---|---|---|
| Everyone, reported fracture adverse event (broader coding group) | 3.5% | 3.6% | About 35.0 vs 36.0 | About −1.0 |
| Women, hip or pelvis fracture | 24 of 2,448 | 5 of 2,424 | 9.8 vs 2.1 | +7.7 |
| Age 75+, hip or pelvis fracture | 17 of 703 | 4 of 663 | 24.2 vs 6.0 | +18.1 |
Source: reported-fracture-adverse-event row from Kushner et al., Obesity 2025; subgroup counts from the Wegovy prescribing information, rev. 06/2026; per-1,000 math by The RX Index. The women and 75+ groups overlap. Don't add them together. The label gives an overall median follow-up of 41.8 months; the safety paper gives a mean of 39.8 months. Both are correct. SELECT systematically collected serious adverse events, events leading to stopping treatment, and selected events of special interest—not every nonserious fracture.
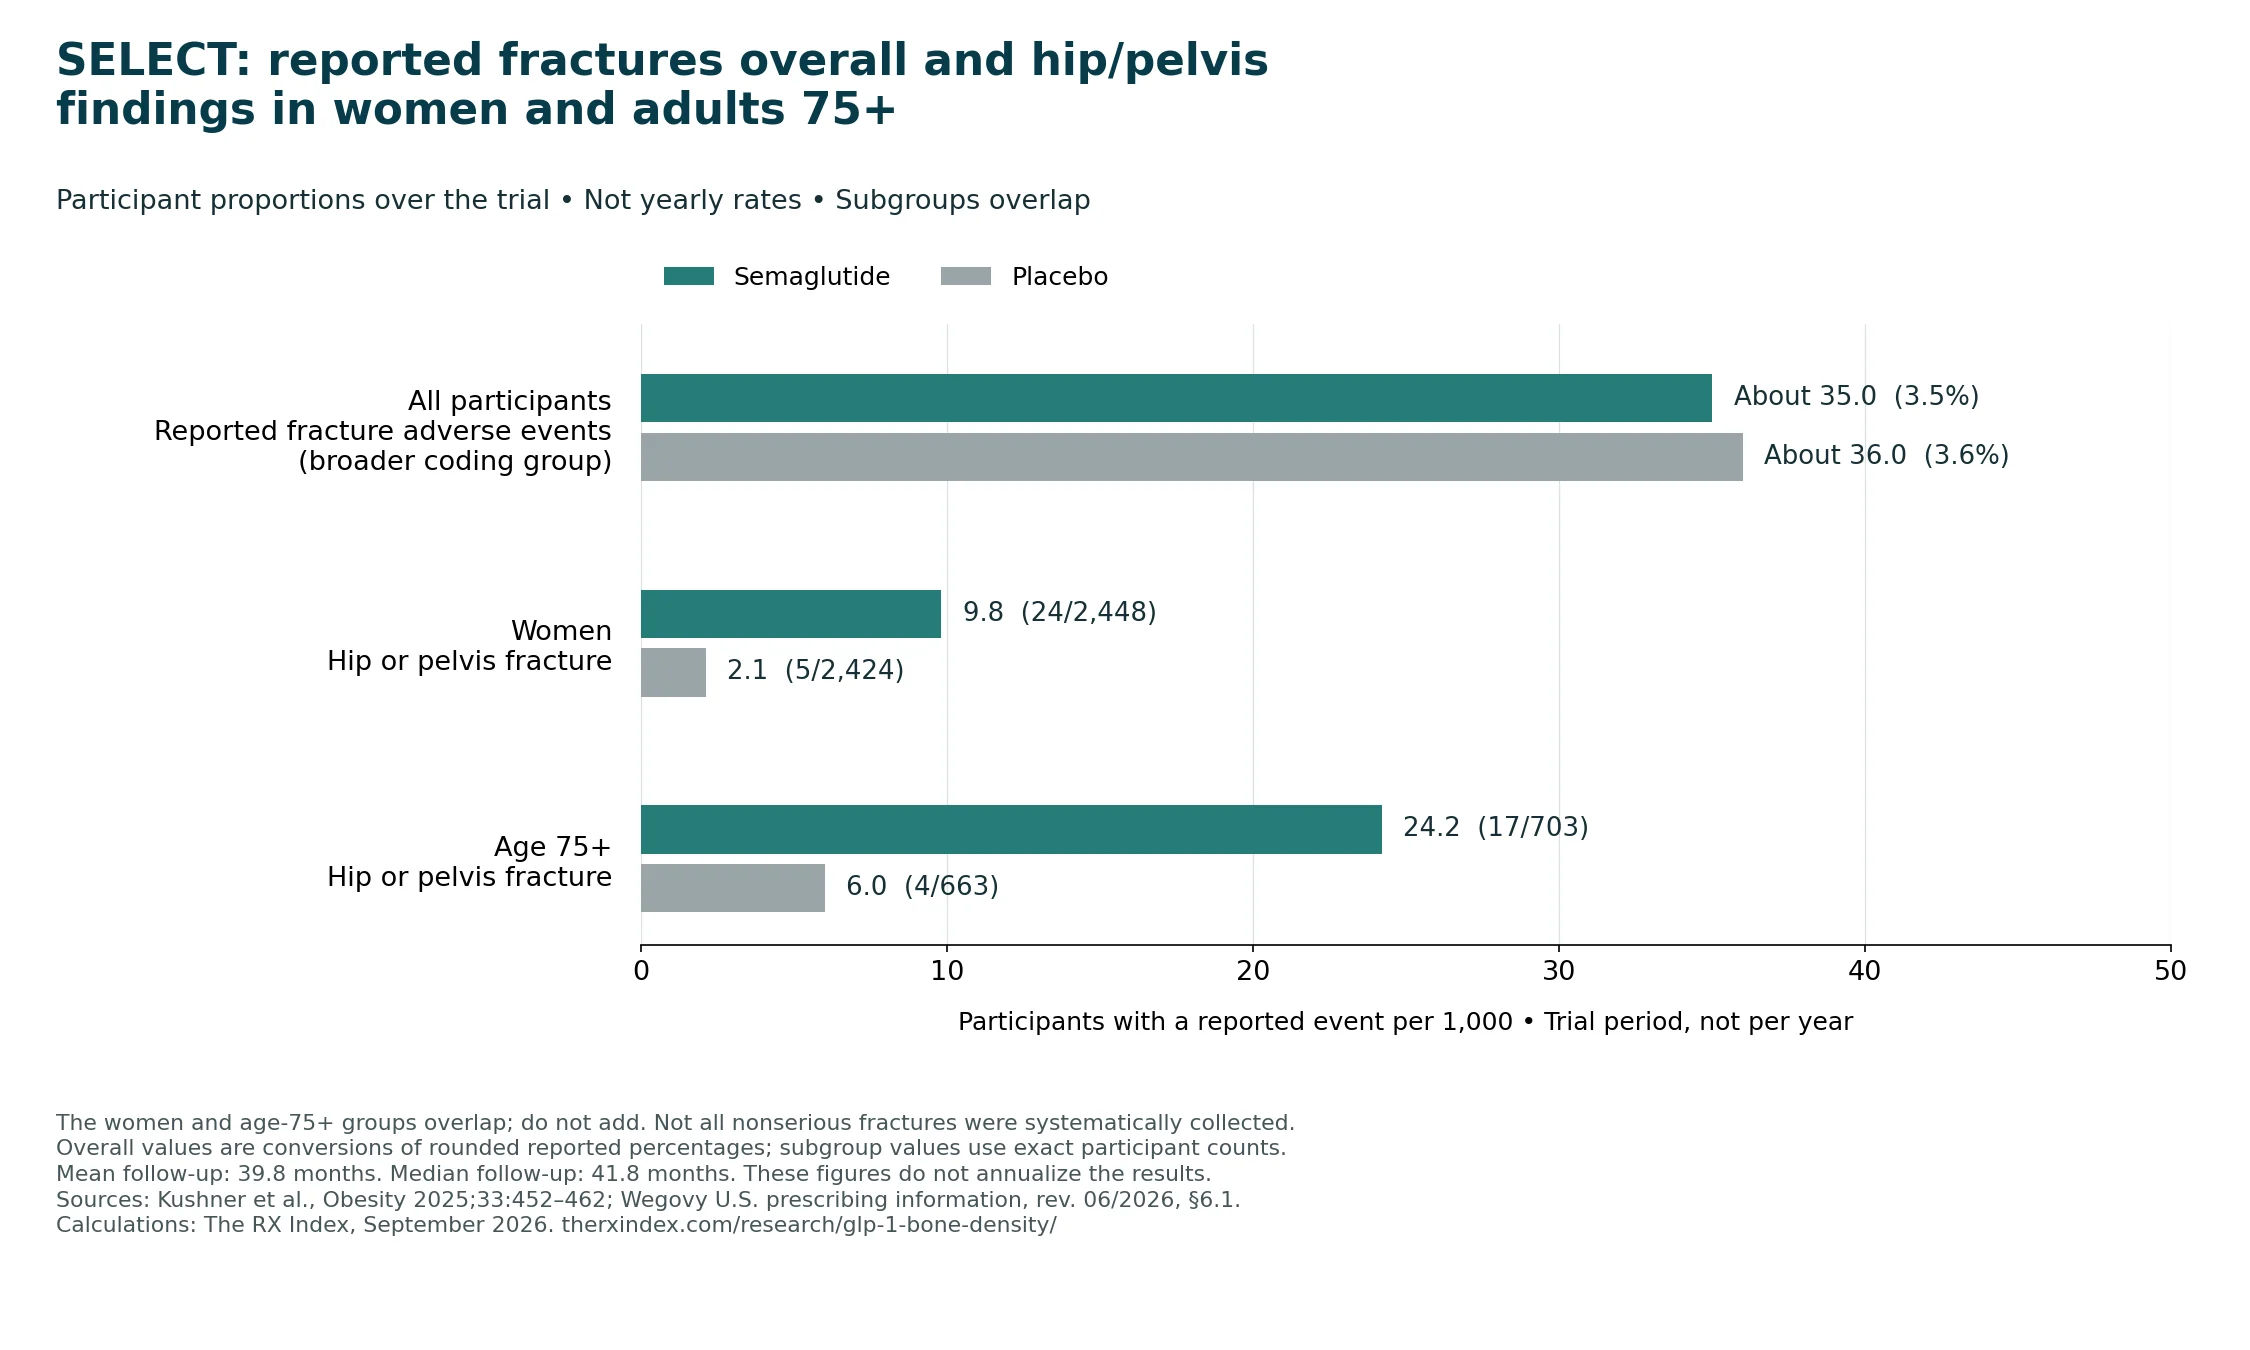
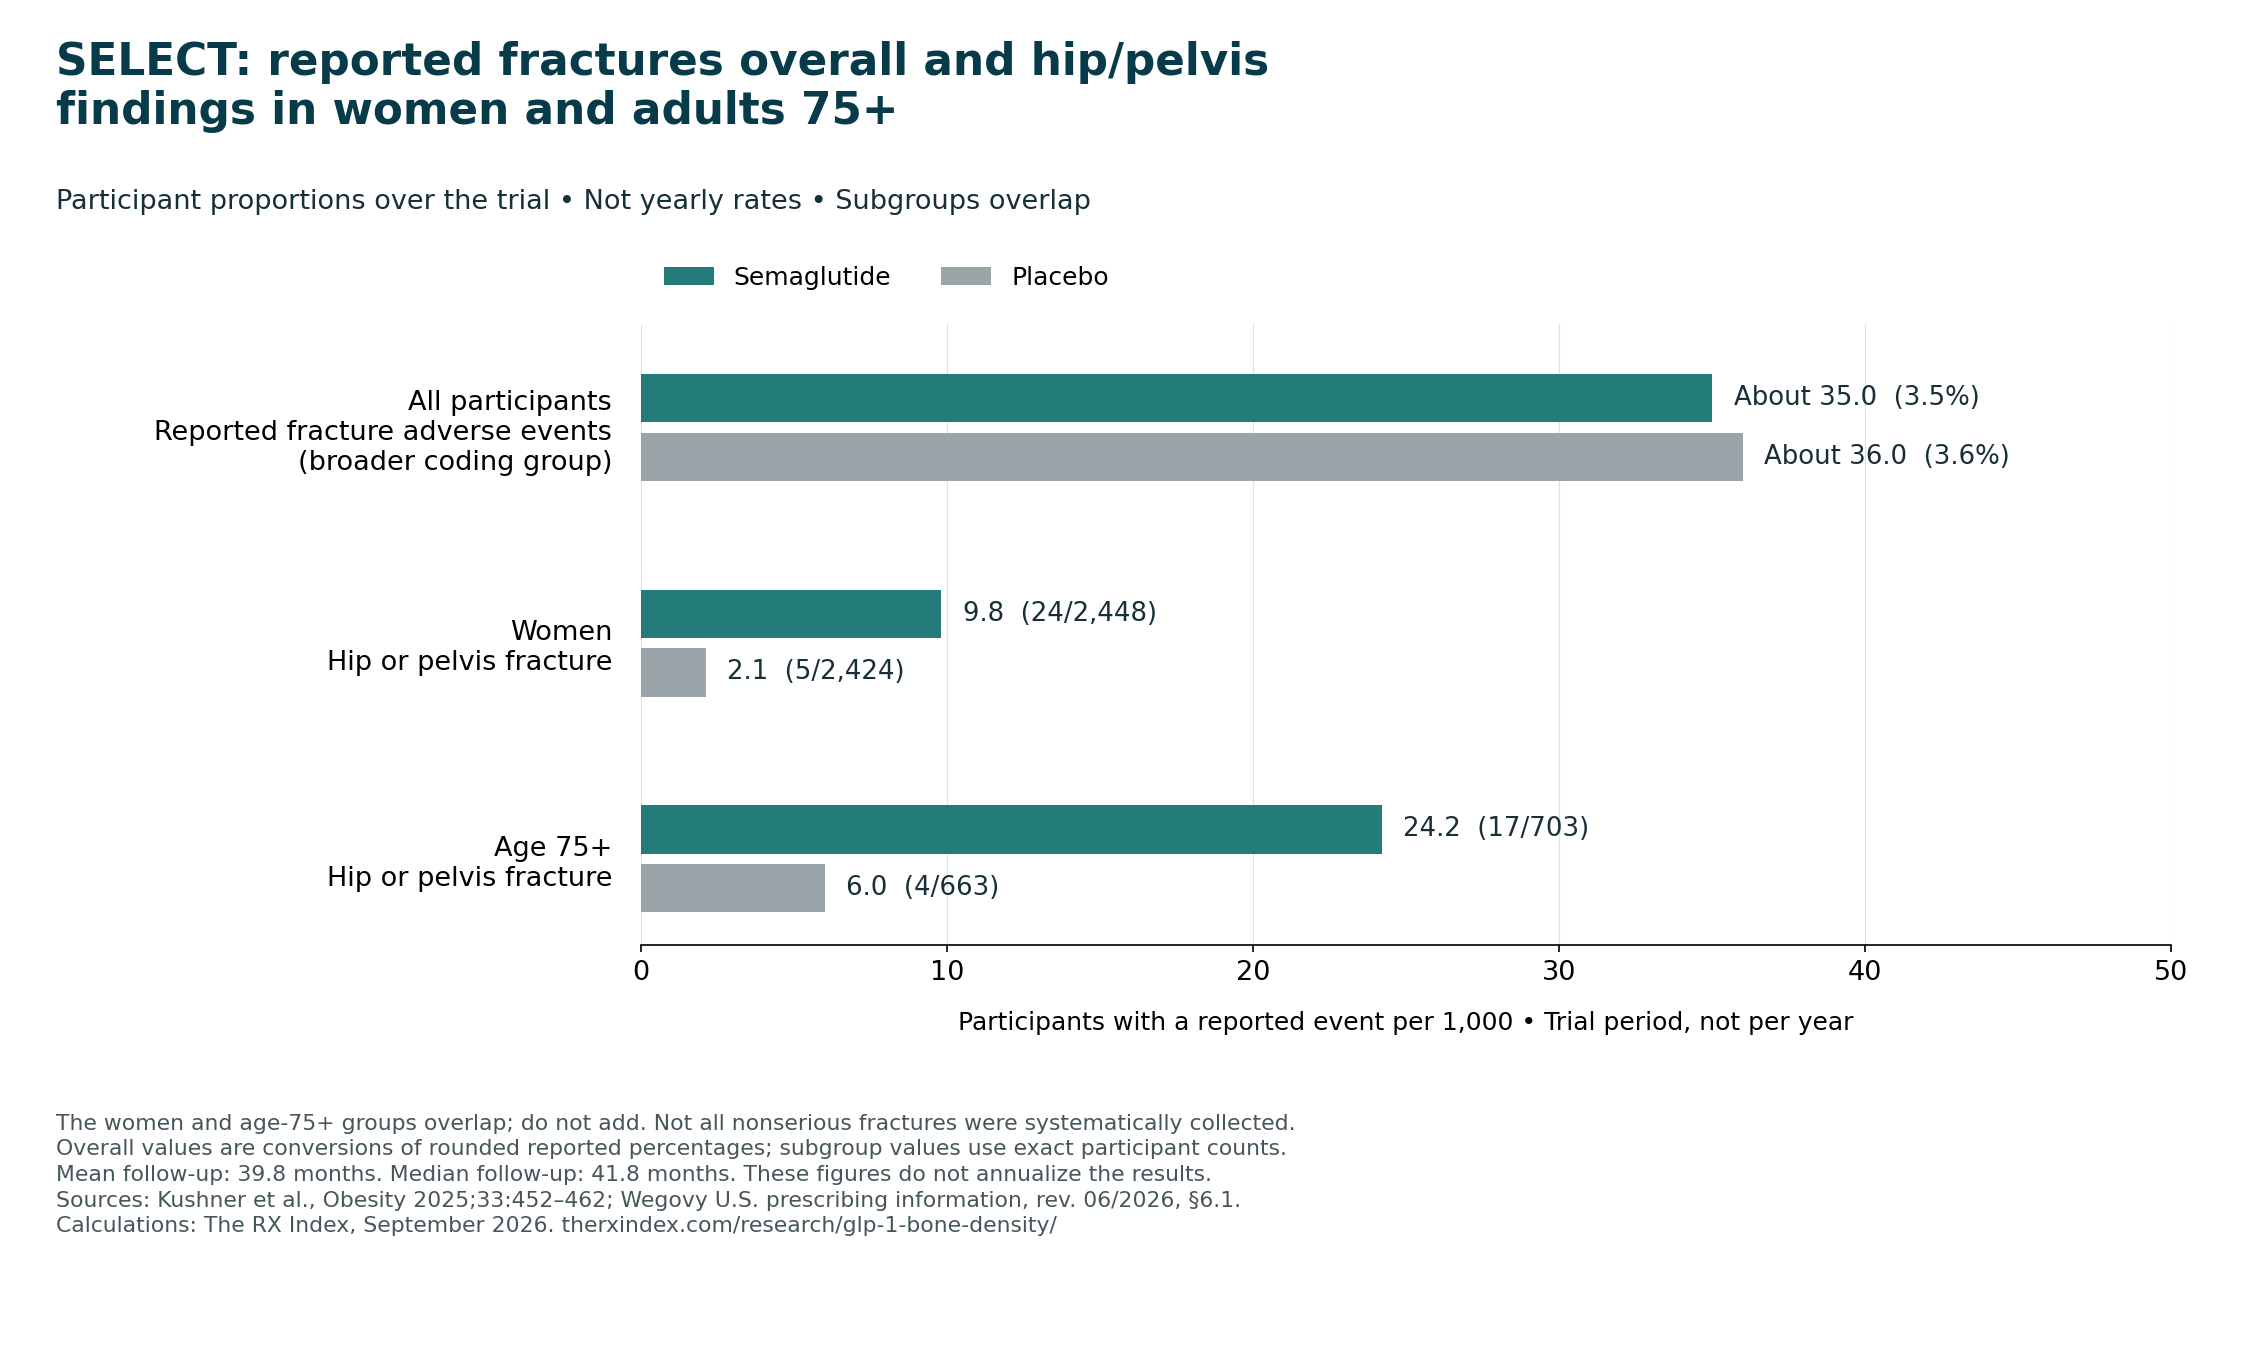
Scaled to 1,000 participants aged 75 or older, the observed counts equal about 24 people with a hip or pelvis fracture on semaglutide and about 6 on placebo. That's roughly 18 more over the trial—not a prediction that 18 extra fractures would occur in every new group of 1,000.
What the label says, and what it doesn't
The label reports counts. It doesn't say the drug caused them. The SELECT safety paper described no overall imbalance in the fracture adverse events it collected and called the hip and pelvis gaps "numerical" imbalances in small groups (Kushner et al., 2025). The numbers are small: 24 women with a hip or pelvis fracture vs 5, and 17 participants vs 4 at age 75 and older.
Numbers that small can swing a lot, so one trial can't settle it. That's why the older-adult studies and the diabetes split elsewhere on this page matter.
The liver (MASH) trial is a separate count
The Wegovy label also reports a trial in adults with MASH, a fatty-liver disease. There, 4.4% of people on Wegovy had a fracture vs 3.3% on placebo. Separately, the label reports rates of 2.6 vs 2.0 per 100 patient-years (Wegovy prescribing information). Different people, different yardstick. Keep it apart from the SELECT numbers.
Which GLP-1 labels mention fractures?
Only 1 of the 6 U.S. prescribing-information documents checked here contains a clinical fracture finding: Wegovy's. Ozempic contains the same drug, semaglutide, but its reviewed label has no such statement. Neither do the checked Mounjaro, Zepbound, Saxenda or Foundayo labels. This is a review of these six editions, not every GLP-1 product.
| Brand (drug) | Label version checked | Clinical fracture or bone-density statement found? | What it says |
|---|---|---|---|
| Wegovy (semaglutide) | Revised 06/2026 | Yes | Heart trial: hip and pelvis fractures 1% (24/2,448) vs 0.2% (5/2,424) in women; 2.4% (17/703) vs 0.6% (4/663) at age 75+. MASH trial: any fracture 4.4% vs 3.3% |
| Ozempic (semaglutide) | Revised 05/2026 | No | — |
| Mounjaro (tirzepatide) | Revised 08/2026 | No | — |
| Zepbound (tirzepatide) | Revised 08/2026 | No | Nonclinical bone-marrow testing and peptide-backbone wording are not patient bone outcomes |
| Saxenda (liraglutide) | Revised 02/2026 | No | Pelvis matches concern fetal animal findings, not adult fracture outcomes |
| Foundayo (orforglipron) | Revised 04/2026 | No | — |
Source: official prescribing information for Wegovy, Ozempic, Mounjaro, Zepbound, Saxenda and Foundayo; each searched for “fracture,” “bone mineral,” “osteopor,” “hip” and “pelvis,” with the clinical context read. Mounjaro’s August 2026 edition was checked in DailyMed. Check done by The RX Index.
A silent label isn't a clean bill of health. It means we found no explicit clinical fracture or BMD statement in that reviewed edition. For how GLP-1 labels have changed over time, see our GLP-1 FDA label changes tracker.
What do tirzepatide (Zepbound, Mounjaro) studies show?
We found no randomized human hip or spine bone-density result for tirzepatide, and a 2026 pooled analysis says its phase 3 trials didn't assess bone density. In adults 65 and older with type 2 diabetes, it was linked to fewer femoral fractures than DPP-4 inhibitors (1.9 vs 4.4 per 1,000 in one year). Compared with other GLP-1s, it was linked to a 44% higher hazard of a combined “osteoporosis or fracture” outcome (Chen, Hsu, Alfaris).
That sounds like a contradiction. The studies compared tirzepatide with different things and counted different outcomes. Their differences explain why the numbers cannot be treated as the same question; they do not settle which finding best predicts future fractures.
| Study | Who | Compared with | Outcome | Result |
|---|---|---|---|---|
| Chen 2026 | Age 65+, type 2 diabetes; 12,808 per group | DPP-4 inhibitor | Femoral fracture, 1 year | 24 vs 56 (1.9 vs 4.4 per 1,000); HR 0.452 (0.280–0.729) |
| Hsu 2025 | Type 2 diabetes or obesity; 66,329 per group | Other GLP-1 drugs | New osteoporosis OR fragility fracture, combined, 14 months | HR 1.44 (1.22–1.69) |
| Hsu 2025 | Type 2 diabetes or obesity; this comparison’s matched count not stated in the accessible abstract | Non-users | Same combined outcome | HR 1.48 (1.26–1.75) |
| Alfaris 2026 | Age 65+ in 7 trials; 586 on tirzepatide, 340 on placebo | Placebo | Fractures reported as side effects | No consistent imbalance described; small descriptive counts, not proof of equal risk; see Table 9 |
| Phase 3 trials in the Alfaris 2026 pool | — | — | Bone density | Not assessed, per the authors |
Source: the studies linked in the table, checked September 29, 2026; per-1,000 math by The RX Index.
Why "44% more fractures" is the wrong summary
The 1.44 hazard ratio counts two things together: a new osteoporosis diagnosis or a fragility fracture. The abstract doesn't split them. So “44% more fractures” does not describe the reported composite. The same study found tirzepatide users were also more likely to start an osteoporosis medicine (HR 1.61, 1.22–2.12). That points to more diagnoses and treatment, but the abstract doesn't say how many of the events were actual breaks.
What the trials in people 65 and older counted
Eli Lilly pooled the side-effect reports from seven tirzepatide trials for people 65 and older. The authors described fracture and fall rates as broadly comparable; the small pooled counts do not establish equal risk. They also wrote that this is hard to read, because none of the trials measured bone density and the follow-up may have been too short.
| Fracture type | Tirzepatide (586) | Placebo (340) | Per 1,000 (tirzepatide vs placebo) |
|---|---|---|---|
| Limb fracture | 9 | 11 | 15.4 vs 32.4 |
| Spinal fracture | 5 | 1 | 8.5 vs 2.9 |
| Thoracic cage (chest) fracture | 2 | 4 | 3.4 vs 11.8 |
| Hip fracture | 0 | 1 | 0.0 vs 2.9 |
| Falls | 21 | 12 | 35.8 vs 35.3 |
Source: Alfaris et al., Diabetes, Obesity and Metabolism 2026, Table 1 (Lilly-funded post hoc analysis); per-1,000 math by The RX Index. Very few events, pooled from trials with different designs, and one person can appear in more than one row.
The missing bone-density data
Tirzepatide’s phase 3 obesity trials produced substantial weight loss. Neither reviewed label has a clinical fracture or BMD statement. The authors of the 2026 pooled analysis say bone density wasn't assessed in the phase 3 trials they pooled. As of September 29, 2026, we found no randomized trial reporting what it does to hip or spine bone density. That's the biggest hole in this whole map.
Are older adults at higher risk?
Some of the strongest warning signs come from older adults: 24.2 vs 6.0 hip or pelvis fractures per 1,000 at age 75+ in Wegovy's heart trial, and an 11% higher fragility-fracture hazard in people 65+ with type 2 diabetes in Israel. But another study of people 65+ with diabetes found about half as many femoral fractures on semaglutide or tirzepatide as on DPP-4 inhibitors.
| Study | Who | Compared with | Result |
|---|---|---|---|
| SELECT, Wegovy label | Age 75+, no diabetes | Placebo | Hip or pelvis fracture 24.2 vs 6.0 per 1,000 over the trial |
| Kasher Meron 2026 | 46,177 age 65+ with type 2 diabetes | SGLT-2 or DPP-4 inhibitor | Fragility fracture HR 1.11 (1.01–1.21) over a median 34.7 months |
| Constantine 2026 | Age 78–88, overweight or obesity, no diabetes | Matched non-users | 1-year fracture 9.28% vs 5.10%; odds ratio 4.99 (2.68–9.26) |
| Chen 2026 | Age 65+ with type 2 diabetes | DPP-4 inhibitor | Femoral fracture: semaglutide 2.5 vs 5.2 per 1,000; tirzepatide 1.9 vs 4.4 per 1,000 (1 year) |
| Alfaris 2026 | Age 65+ in tirzepatide trials | Placebo | Small pooled fracture and fall counts; no consistent imbalance described |
Source: studies linked in the table, checked September 29, 2026; per-1,000 math by The RX Index.
A source mismatch in the Constantine report: the abstract prints 9.28% vs 5.10% for ages 78–88 and an odds ratio of 4.99. Those percentages give a crude odds ratio of about 1.90, not 4.99. For the full cohort, 3.05% ÷ 2.61% is about 1.17, not the printed risk ratio of 1.09. The BMI 40+ subgroup also prints 3.15% vs 1.91% with an OR of 1.26; the crude OR is about 1.67. We could verify what the original abstract reports, but not the full-text model details that might explain these differences. Do not treat the printed ratios as calculations from the percentages shown here.
Chen’s cohort also excluded people with recent falls, fractures or recorded frailty and required later prescriptions consistent with continued treatment. Its lower fracture association should not be applied unchanged to frail older adults (Chen et al., methods).
Age raises the starting line. Even without a GLP-1, 5.10% of people aged 78 to 88 in the orthopedic study broke a bone within a year, about twice the 2.61% rate for that study's whole comparison group. So even a small change in fracture risk matters more here. If you or a parent is over 65 and weighing these drugs, our guide to GLP-1 options for adults over 65 walks through the choices.
Does exercise protect your bones on a GLP-1?
It seems to help, but it isn't proven. In a 195-person trial, liraglutide alone left hip bone density 0.013 g/cm² lower than placebo, while liraglutide plus supervised exercise showed no clear difference from placebo. The exercise-plus-drug group also wasn't clearly better than the drug alone.
Here's how the trial ran. Everyone did an 8-week, 800-calorie diet first. Then they were split into four groups for a year: placebo, exercise, liraglutide 3.0 mg, or both. Bone density changes were measured from before the diet to the end, so each number covers about 60 weeks.
| Comparison | Hip (g/cm²) | Lumbar spine (g/cm²) |
|---|---|---|
| Liraglutide vs placebo | −0.013 (−0.024 to −0.002); P=.02 | −0.019 (−0.034 to −0.004); P=.02 |
| Liraglutide vs exercise | −0.013 (−0.024 to −0.001); P=.03 | −0.016 (−0.032 to −0.001); P=.04 |
| Liraglutide + exercise vs placebo | −0.006 (−0.017 to 0.004); P=.24 | −0.010 (−0.025 to 0.005); P=.20 |
| Liraglutide + exercise vs liraglutide | +0.007 (−0.004 to 0.018); P=.20 | +0.009 (−0.006 to 0.024) |
Source: Jensen et al., JAMA Network Open 2024. 195 adults with obesity and no diabetes, ages 18 to 65. Table 2 gives the spine interval −0.034 to −0.004. The abstract/results sentence prints a conflicting +0.002 upper limit; the table value is used here.
No clear difference from placebo does not mean no bone was lost. In the combination group, hip BMD fell 0.019 g/cm² from before the diet to the end of treatment (95% CI −0.026 to −0.011). The same study reported higher whole-body BMD with liraglutide and with the combination than with placebo. Hip, spine and whole-body findings must stay separate (Jensen et al., Table 2 and BMD results).
Read the last row closely. Adding exercise to liraglutide didn't produce a clear difference compared with liraglutide alone. So the honest takeaway is "exercise looks helpful," not "exercise fixes it." No fragility fractures were reported in any group; this small trial was not powered to establish fracture prevention. For practical steps on holding on to muscle, see how to limit muscle loss on a GLP-1.
Where did the "30% higher osteoporosis risk" headline come from?
It came from a conference study of 73,483 matched pairs of adults with type 2 diabetes and obesity. The authors reported osteoporosis diagnoses in 4.1% of GLP-1 users vs 3.2% of non-users over five years, with a relative risk of 1.29 (95% CI 1.22–1.36). Those rounded percentages equal about 41 vs 32 per 1,000, or about 9 more—not 30% of bone lost (original AAOS abstract).
“About 30% higher” is the reported relative association. “About 9 more per 1,000” translates the rounded reported percentages. But there is a mismatch in the source’s counts that a writer needs to see.
| Way to say it | Number |
|---|---|
| Relative risk, as reported | 1.29 (95% CI 1.22–1.36; “about 30% higher”) |
| Reported percent diagnosed over 5 years | 4.1% vs 3.2% |
| Per 1,000 people over 5 years | About 41 vs 32 |
| Extra diagnoses per 1,000 over 5 years | About 9 |
Source: AAOS 2026 conference abstract and Table 1, also discussed by Lawand and Abboud, AAOS Now, September 18, 2026. Per-1,000 math by The RX Index from rounded percentages.
The denominator check: the same abstract prints 2,955 osteoporosis cases among GLP-1 users and 2,284 among non-users, with 73,483 people in each matched cohort. Dividing those counts by the full cohort sizes gives 4.02% vs 3.11%—40.2 vs 31.1 per 1,000—not 4.1% vs 3.2%. The abstract does not supply a different outcome-at-risk denominator that resolves this. We preserve the reported percentages and the count check separately; neither is silently substituted for the other.
The authors themselves say the study shows a link, not a cause. They note that a prescription doesn't prove someone took the drug, and that no bone scans confirmed the diagnoses. They also reported osteomalacia, a softening of the bones, at 0.2% vs 0.1% (RR 2.55, 95% CI 1.83–3.55). Its 125 vs 49 case counts equal about 1.7 vs 0.7 per 1,000 using the full cohort sizes; those crude values are kept apart from the rounded reported percentages. This is conference-level evidence with an investigator write-up, not a full peer-reviewed paper verified in this audit.
What should you ask your doctor?
These studies can sharpen the questions you bring to your prescriber. They can't tell you which drug is best for your bones or whether to start or stop one. That call depends on your health history and on the benefits you'd get from treatment.
Questions worth asking, based on where the evidence points:
- Do I already have low bone density or a past fracture? The 2024 semaglutide trial was done in exactly that group.
- Would a bone density (DXA) scan before or during treatment make sense for me?
- I don't have diabetes. Does that change how you'd watch my bones?
- I'm over 65 (or 75). How do my fall and fracture risks factor in?
- I'm eating a lot less now. Am I getting enough protein, calcium and vitamin D?
- Is strength training safe for me, and where would I start?
Our list of questions to bring to your GLP-1 prescriber covers the rest of that conversation. If you're in perimenopause, see GLP-1 choices during perimenopause. And if you're still comparing options, Find My GLP-1 Path sorts the choices by your goals, budget and insurance in about two minutes. It doesn't estimate fracture risk.
Why this matters now
This September 2026 edition brings newer fracture reports alongside earlier bone-density trials. It includes 15 selected GLP-1 study reports, and the checked Wegovy prescribing information is revised June 2026. The underlying observations come from different years; a new paper or label edition does not make its patient data new.
| Date | What was published |
|---|---|
| 2015 | Iepsen: liraglutide and BMC after diet-induced weight loss |
| 2019 | Cheng meta-analysis: GLP-1s in diabetes trials, fracture odds ratio 0.71 |
| May 2024 | Hansen trial: semaglutide 1.0 mg, hip −2.59% vs placebo |
| June 2024 | Jensen trial: liraglutide and exercise |
| February 2025 | SELECT safety paper: reported fracture adverse events 3.5% vs 3.6% overall |
| November 2025 | Hsu: tirzepatide vs other GLP-1s, combined outcome HR 1.44 |
| December 2025 | Constantine paper published online; June 2026 journal issue |
| February 2026 | Liu (bone density by diabetes status) and Kasher Meron (HR 1.11, age 65+) online |
| March 2026 | Epic Research brief; AAOS conference study |
| April 2026 | Huang: semaglutide and fractures by diabetes status |
| June 2026 | Alfaris (tirzepatide, age 65+) online; checked Wegovy label revision |
| July 2026 | Chen (femoral fractures, age 65+); Hamad (133,606 people, HR 0.79) |
| September 2026 | AAOS Now report of the osteoporosis study (4.1% vs 3.2%) |
Source: publication or online dates from each source in the Sources list. These are publication dates, not the years the data were collected.
How we built this
We collected published results on GLP-1 drugs and bone density, osteoporosis and fractures, then recorded who was studied, what they were compared with, what was measured and for how long, before copying any number. The retained claims were checked on September 29, 2026, at the source depths listed below.
- What we included: 15 selected GLP-1 study reports (randomized trials and secondary analyses, a meta-analysis, health-record studies, a research brief and a conference study), the 6 reviewed U.S. prescribing-information documents, and 1 separate diet-trial report for context. The dataset has 80 records, including 3 dated evidence-gap records. A record is one result, label observation or gap—not one independent study. Reports may use overlapping participants.
- How deep we checked: full text and relevant results/tables for Hansen, Jensen, SELECT safety, Hamad, Huang, Chen and Alfaris; original published abstracts for Kasher Meron, Hsu, Liu, Constantine, Cheng, Iepsen and the Villareal diet trial; the full Epic Research brief, definitions and PDF text; and the original AAOS conference abstract/table plus the September investigator report. Some publisher pages were inaccessible, so original abstracts were read in PubMed or the author institution’s repository. Epic’s graphical confidence bounds were not numerically extracted. Each record states its access depth.
- Labels: we searched each official prescribing-information document for “fracture,” “bone mineral,” “osteopor,” “hip” and “pelvis,” and read the matches in context. We checked the PDF revision pages. For Mounjaro, conflicting cached PDF revisions led us to the consistent August 2026 DailyMed edition. “No statement found” applies only to the six reviewed editions.
- Population comparisons: we kept diabetes status, bone site, outcome and comparator on every record. We did not count whole studies as “better” or “worse”: Jensen’s hip and whole-body findings differ, and some reports change comparators or follow-up across diabetes groups. Hamad’s within-report sensitivity analysis is shown with its actual never-user comparator.
- The math: per 1,000 = people with the event ÷ people in the group × 1,000. Example: 17 ÷ 703 × 1,000 = 24.2. Differences use unrounded inputs, then round once to one decimal. Rounded reported percentages are multiplied by 10 and marked “about.” Modelled HRs, odds ratios and confidence intervals are copied from the primary report, not recreated from patient data. They need not equal crude proportions.
- Source conflicts: Liu’s original abstract gives −0.6% for the control group’s annualized hip BMD change. Jensen’s Table 2, rather than its conflicting abstract sentence, supplies the spine interval. Constantine’s printed ratios cannot be reconstructed from its displayed percentages without model details we could not access. AAOS’s printed case counts and full cohort sizes do not reproduce its printed percentages. Those unresolved relationships stay visible.
- What we didn't do: we didn't pool studies into one effect estimate, reanalyze patient data, or rate any drug as safest. This is a targeted evidence map, not a systematic review. Search-gap records mean no qualifying result was located in this review, not that no such study can exist.
To reproduce an original conversion, open its record in the CSV, follow the source link, and redo the math in the calculation column. To check a reported study estimate, use the listed source table or passage. Recreating a clinical model would require its data and methods, which this map does not provide.
What this data does and doesn't show
The map shows what the 15 selected GLP-1 study reports and 6 reviewed labels reported as of September 29, 2026, with one diet trial kept as context. It shows lower hip and spine BMD in selected randomized comparisons, favorable findings for other bone measures, and differing fracture associations. It does not establish that GLP-1s cause fractures, and it cannot tell you your own risk.
What it does show:
- GLP-1 treatment lowered hip and spine bone density a little in two randomized trials of people without diabetes.
- In SELECT, reported fracture adverse-event proportions were similar overall, with higher hip/pelvis proportions in women and adults 75+. Nonserious fractures were not all systematically collected.
- Some reports find different associations by diabetes status. Different endpoints, comparators, follow-up and mixed bone-site findings prevent a simple whole-study tally.
- Only Wegovy’s label among the six reviewed editions contains a clinical fracture finding.
What it doesn't show:
- That any GLP-1 causes fractures. Most fracture results come from health records, where the people who get a drug can differ from those who don't in ways the researchers can't fully measure.
- A ranking of drugs. Semaglutide and tirzepatide were never compared head to head for bones in these studies.
- What happens to human BMD after stopping treatment. No qualifying human recovery result was located in this targeted search. Animal withdrawal findings do not answer that question.
- Anything about doses or products with no data, including a randomized estimate of tirzepatide’s hip/spine BMD effect or a qualifying human bone-outcome report for orforglipron.
- Your personal risk. Trial averages don't account for your age, bone density, falls history, diet or activity.
Several studies were funded by drugmakers (Alfaris by Eli Lilly; SELECT by Novo Nordisk; Novo Nordisk supplied the drug for Hansen). Health-record studies depend on diagnosis codes, which can be wrong or missing.
How to cite this page
Cite the original study for its own findings. Cite this page when you use The RX Index's evidence map, label review or per-1,000 calculations.
Coziar, Kaden. "GLP-1 Bone Density and Fracture Risk: 15 Study Reports by Drug." The RX Index Research. September 2026; evidence checked September 29, 2026. https://therxindex.com/research/glp-1-bone-density/
Reuse: You’re welcome to reuse The RX Index’s original text, table layout, chart designs and calculations with credit to The RX Index. Keep the underlying study and label citations; their text, figures and other protected material retain their original rights and terms. No link is required.
Download the data
Download the GLP-1 Bone Evidence Map CSV.
The file contains 80 records, not 80 studies: study results, six label observations, a diet-trial context record and three dated evidence-gap records. Every record has a source or search-log reference, check date, outcome definition and verification status. Empty numeric cells mean unavailable or not extracted, not zero.
Look up drug and outcome
Choose any combination. The full 80-row map remains available below, including when filters are not active.
Showing all 80 records in source-ID and row-ID order.
No matching record in this selected map as of September 29, 2026. This is not a claim that no such study exists anywhere. Relevant dated search-gap records are shown below when available.
| Row ID | Drug and population | Evidence and comparator | Outcome and measure | Counts and absolute values | Follow-up | Source and locator | Data status | Limits and notes |
|---|---|---|---|---|---|---|---|---|
| S01-ctx | semaglutide 64 adults at increased fracture risk (low BMD or recent fragility fracture); no diabetes; 32 randomized per arm No diabetes | randomized_trial_or_secondary_analysis Comparator: Placebo | Serum CTX (bone-breakdown blood marker) Relative estimated treatment difference in change from baseline 54.8 % vs placebo 95% CI: 17.5 to 92.1 | Not available in this extraction | 52 weeks | Hansen MS et al. Once-weekly semaglutide versus placebo in adults with increased fracture risk. eClinicalMedicine 2024;72:102624 full text; Table 2 Access: full text; Table 2 | Verified | A blood marker, not the percentage of bone lost. Secondary outcomes except PINP; no multiplicity adjustment. This is not an individual forecast or a fracture-risk estimate. |
| S01-femneck | semaglutide 64 adults at increased fracture risk (low BMD or recent fragility fracture); no diabetes; 32 randomized per arm No diabetes | randomized_trial_or_secondary_analysis Comparator: Placebo | Femoral neck areal BMD (DXA) Relative estimated treatment difference in change from baseline -1.06 % vs placebo 95% CI: -2.82 to 0.71 | Not available in this extraction | 52 weeks | Hansen MS et al. Once-weekly semaglutide versus placebo in adults with increased fracture risk. eClinicalMedicine 2024;72:102624 full text; Table 2 Access: full text; Table 2 | Verified | No clear difference (p=0.236). Secondary outcomes except PINP; no multiplicity adjustment. This is not an individual forecast or a fracture-risk estimate. |
| S01-hip | semaglutide 64 adults at increased fracture risk (low BMD or recent fragility fracture); no diabetes; 32 randomized per arm No diabetes | randomized_trial_or_secondary_analysis Comparator: Placebo | Total hip areal BMD (DXA) Relative estimated treatment difference in change from baseline -2.59 % vs placebo 95% CI: -4.07 to -1.11 | Not available in this extraction | 52 weeks | Hansen MS et al. Once-weekly semaglutide versus placebo in adults with increased fracture risk. eClinicalMedicine 2024;72:102624 full text; Table 2 Access: full text; Table 2 | Verified | Absolute ETD -0.020 g/cm2 (-0.032 to -0.008). Within-group means: semaglutide 0.785 to 0.764; placebo 0.793 to 0.793. Secondary outcomes except PINP; no multiplicity adjustment. This is not an individual forecast or a fracture-risk estimate. |
| S01-pinp | semaglutide 64 adults at increased fracture risk (low BMD or recent fragility fracture); no diabetes; 32 randomized per arm No diabetes | randomized_trial_or_secondary_analysis Comparator: Placebo | Serum PINP (bone-building blood marker; primary endpoint) Relative estimated treatment difference in change from baseline 17.3 % vs placebo 95% CI: -9.0 to 43.6 | Not available in this extraction | 52 weeks | Hansen MS et al. Once-weekly semaglutide versus placebo in adults with increased fracture risk. eClinicalMedicine 2024;72:102624 full text; Table 2 Access: full text; Table 2 | Verified | No clear difference (p=0.193). Secondary outcomes except PINP; no multiplicity adjustment. This is not an individual forecast or a fracture-risk estimate. |
| S01-radius | semaglutide 64 adults at increased fracture risk (low BMD or recent fragility fracture); no diabetes; 32 randomized per arm No diabetes | randomized_trial_or_secondary_analysis Comparator: Placebo | Wrist (radius) total volumetric BMD (HR-pQCT) Relative estimated treatment difference in change from baseline -0.55 % vs placebo 95% CI: -1.54 to 0.44 | Not available in this extraction | 52 weeks | Hansen MS et al. Once-weekly semaglutide versus placebo in adults with increased fracture risk. eClinicalMedicine 2024;72:102624 full text; Table 2 Access: full text; Table 2 | Verified | No clear difference (p=0.269). Secondary outcomes except PINP; no multiplicity adjustment. This is not an individual forecast or a fracture-risk estimate. |
| S01-spine | semaglutide 64 adults at increased fracture risk (low BMD or recent fragility fracture); no diabetes; 32 randomized per arm No diabetes | randomized_trial_or_secondary_analysis Comparator: Placebo | Lumbar spine areal BMD (DXA) Relative estimated treatment difference in change from baseline -2.05 % vs placebo 95% CI: -3.63 to -0.48 | Not available in this extraction | 52 weeks | Hansen MS et al. Once-weekly semaglutide versus placebo in adults with increased fracture risk. eClinicalMedicine 2024;72:102624 full text; Table 2 Access: full text; Table 2 | Verified | Absolute ETD -0.018 (-0.031 to -0.005). Secondary outcomes except PINP; no multiplicity adjustment. This is not an individual forecast or a fracture-risk estimate. |
| S01-tibia | semaglutide 64 adults at increased fracture risk (low BMD or recent fragility fracture); no diabetes; 32 randomized per arm No diabetes | randomized_trial_or_secondary_analysis Comparator: Placebo | Shin (tibia) total volumetric BMD (HR-pQCT) Relative estimated treatment difference in change from baseline -1.69 % vs placebo 95% CI: -2.95 to -0.42 | Not available in this extraction | 52 weeks | Hansen MS et al. Once-weekly semaglutide versus placebo in adults with increased fracture risk. eClinicalMedicine 2024;72:102624 full text; Table 2 Access: full text; Table 2 | Verified | Weight-bearing site. Secondary outcomes except PINP; no multiplicity adjustment. This is not an individual forecast or a fracture-risk estimate. |
| S01-weight | semaglutide 64 adults at increased fracture risk (low BMD or recent fragility fracture); no diabetes; 32 randomized per arm No diabetes | randomized_trial_or_secondary_analysis Comparator: Placebo | Body weight Relative estimated treatment difference in change from baseline -8.8 % vs placebo 95% CI: -11.7 to -6.0 | Not available in this extraction | 52 weeks | Hansen MS et al. Once-weekly semaglutide versus placebo in adults with increased fracture risk. eClinicalMedicine 2024;72:102624 full text; Table 2 Access: full text; Table 2 | Verified | ETD -6.8 kg. Secondary outcomes except PINP; no multiplicity adjustment. This is not an individual forecast or a fracture-risk estimate. |
| S02-combo-v-lira-hip | liraglutide + exercise 195 adults with obesity (BMI 32-43) after an 8-week 800 kcal/day diet No diabetes | randomized_trial_or_secondary_analysis Comparator: Liraglutide alone | Hip BMD (DXA) Between-group difference in BMD change 0.007 g/cm2 95% CI: -0.004 to 0.018 | Not available in this extraction | 8-week diet before randomization plus 52-week treatment; BMD change from week -8 to week 52 (60 weeks) | Jensen SBK et al. Bone Health After Exercise Alone, GLP-1 Receptor Agonist Treatment, or Combination Treatment. JAMA Netw Open 2024;7(6):e2416775 full text; Table 2 and whole-body BMD results Access: full text; Table 2 and whole-body BMD results | Verified | P=.20; no clear difference. |
| S02-combo-v-lira-spine | liraglutide + exercise 195 adults with obesity (BMI 32-43) after an 8-week 800 kcal/day diet No diabetes | randomized_trial_or_secondary_analysis Comparator: Liraglutide alone | Lumbar spine BMD (DXA) Between-group difference in BMD change 0.009 g/cm2 95% CI: -0.006 to 0.024 | Not available in this extraction | 8-week diet before randomization plus 52-week treatment; BMD change from week -8 to week 52 (60 weeks) | Jensen SBK et al. Bone Health After Exercise Alone, GLP-1 Receptor Agonist Treatment, or Combination Treatment. JAMA Netw Open 2024;7(6):e2416775 full text; Table 2 and whole-body BMD results Access: full text; Table 2 and whole-body BMD results | Verified | No clear difference. |
| S02-combo-v-plac-hip | liraglutide + exercise 195 adults with obesity (BMI 32-43) after an 8-week 800 kcal/day diet No diabetes | randomized_trial_or_secondary_analysis Comparator: Placebo | Hip BMD (DXA) Between-group difference in BMD change -0.006 g/cm2 95% CI: -0.017 to 0.004 | Not available in this extraction | 8-week diet before randomization plus 52-week treatment; BMD change from week -8 to week 52 (60 weeks) | Jensen SBK et al. Bone Health After Exercise Alone, GLP-1 Receptor Agonist Treatment, or Combination Treatment. JAMA Netw Open 2024;7(6):e2416775 full text; Table 2 and whole-body BMD results Access: full text; Table 2 and whole-body BMD results | Verified | P=.24; no clear difference. |
| S02-combo-v-plac-spine | liraglutide + exercise 195 adults with obesity (BMI 32-43) after an 8-week 800 kcal/day diet No diabetes | randomized_trial_or_secondary_analysis Comparator: Placebo | Lumbar spine BMD (DXA) Between-group difference in BMD change -0.01 g/cm2 95% CI: -0.025 to 0.005 | Not available in this extraction | 8-week diet before randomization plus 52-week treatment; BMD change from week -8 to week 52 (60 weeks) | Jensen SBK et al. Bone Health After Exercise Alone, GLP-1 Receptor Agonist Treatment, or Combination Treatment. JAMA Netw Open 2024;7(6):e2416775 full text; Table 2 and whole-body BMD results Access: full text; Table 2 and whole-body BMD results | Verified | P=.20; no clear difference. |
| S02-combo-within-hip | liraglutide + exercise 195 adults with obesity (BMI 32-43) after an 8-week 800 kcal/day diet No diabetes | randomized_trial_or_secondary_analysis Comparator: Own pre-diet baseline; not placebo | Hip BMD within combination group Within-group change from pre-diet baseline -0.019 g/cm2 95% CI: -0.026 to -0.011 | Not available in this extraction | 8-week diet before randomization plus 52-week treatment; BMD change from week -8 to week 52 (60 weeks) | Jensen SBK et al. Bone Health After Exercise Alone, GLP-1 Receptor Agonist Treatment, or Combination Treatment. JAMA Netw Open 2024;7(6):e2416775 full text; Table 2 and whole-body BMD results Access: full text; Table 2 and whole-body BMD results | Verified | Table 2. Demonstrates that no clear combination-versus-placebo difference is not the same as no bone loss. |
| S02-fragility-reports | liraglutide, exercise, combination or placebo (all arms) 195 adults with obesity (BMI 32-43) after an 8-week 800 kcal/day diet No diabetes | randomized_trial_or_secondary_analysis Comparator: All four groups; no comparison estimated | Reported fragility fractures across all four groups Reported absence of events, not an estimated treatment effect 0 reported in any group reported fragility fractures 95% CI not available in this extraction | Not available in this extraction | 8-week diet before randomization plus 52-week treatment; BMD change from week -8 to week 52 (60 weeks) | Jensen SBK et al. Bone Health After Exercise Alone, GLP-1 Receptor Agonist Treatment, or Combination Treatment. JAMA Netw Open 2024;7(6):e2416775 Results: Study participants Access: full text; Table 2 and whole-body BMD results | Verified | The article states that no fragility fractures were reported in any group. The trial was not powered to establish fracture prevention; randomized sample size is not assumed to be a complete-follow-up risk denominator. |
| S02-lira-v-ex-hip | liraglutide 195 adults with obesity (BMI 32-43) after an 8-week 800 kcal/day diet No diabetes | randomized_trial_or_secondary_analysis Comparator: Exercise alone | Hip BMD (DXA) Between-group difference in BMD change -0.013 g/cm2 95% CI: -0.024 to -0.001 | Not available in this extraction | 8-week diet before randomization plus 52-week treatment; BMD change from week -8 to week 52 (60 weeks) | Jensen SBK et al. Bone Health After Exercise Alone, GLP-1 Receptor Agonist Treatment, or Combination Treatment. JAMA Netw Open 2024;7(6):e2416775 full text; Table 2 and whole-body BMD results Access: full text; Table 2 and whole-body BMD results | Verified | P=.03. |
| S02-lira-v-ex-spine | liraglutide 195 adults with obesity (BMI 32-43) after an 8-week 800 kcal/day diet No diabetes | randomized_trial_or_secondary_analysis Comparator: Exercise alone | Lumbar spine BMD (DXA) Between-group difference in BMD change -0.016 g/cm2 95% CI: -0.032 to -0.001 | Not available in this extraction | 8-week diet before randomization plus 52-week treatment; BMD change from week -8 to week 52 (60 weeks) | Jensen SBK et al. Bone Health After Exercise Alone, GLP-1 Receptor Agonist Treatment, or Combination Treatment. JAMA Netw Open 2024;7(6):e2416775 full text; Table 2 and whole-body BMD results Access: full text; Table 2 and whole-body BMD results | Verified | P=.04. |
| S02-lira-v-plac-hip | liraglutide 195 adults with obesity (BMI 32-43) after an 8-week 800 kcal/day diet No diabetes | randomized_trial_or_secondary_analysis Comparator: Placebo | Hip BMD (DXA) Between-group difference in BMD change -0.013 g/cm2 95% CI: -0.024 to -0.002 | Not available in this extraction | 8-week diet before randomization plus 52-week treatment; BMD change from week -8 to week 52 (60 weeks) | Jensen SBK et al. Bone Health After Exercise Alone, GLP-1 Receptor Agonist Treatment, or Combination Treatment. JAMA Netw Open 2024;7(6):e2416775 full text; Table 2 and whole-body BMD results Access: full text; Table 2 and whole-body BMD results | Verified | P=.02. |
| S02-lira-v-plac-spine | liraglutide 195 adults with obesity (BMI 32-43) after an 8-week 800 kcal/day diet No diabetes | randomized_trial_or_secondary_analysis Comparator: Placebo | Lumbar spine BMD (DXA) Between-group difference in BMD change -0.019 g/cm2 95% CI: -0.034 to -0.004 | Not available in this extraction | 8-week diet before randomization plus 52-week treatment; BMD change from week -8 to week 52 (60 weeks) | Jensen SBK et al. Bone Health After Exercise Alone, GLP-1 Receptor Agonist Treatment, or Combination Treatment. JAMA Netw Open 2024;7(6):e2416775 full text; Table 2 and whole-body BMD results Access: full text; Table 2 and whole-body BMD results | Verified | P=.02. Verified against Table 2. The abstract/results sentence prints a conflicting +0.002 upper limit; Table 2 gives -0.004. |
| S02-whole-body | liraglutide 195 adults with obesity (BMI 32-43) after an 8-week 800 kcal/day diet No diabetes | randomized_trial_or_secondary_analysis Comparator: Placebo | Whole-body BMD Qualitative between-group result Liraglutide alone and liraglutide plus exercise favored placebo comparison 95% CI not available in this extraction | Not available in this extraction | 8-week diet before randomization plus 52-week treatment; BMD change from week -8 to week 52 (60 weeks) | Jensen SBK et al. Bone Health After Exercise Alone, GLP-1 Receptor Agonist Treatment, or Combination Treatment. JAMA Netw Open 2024;7(6):e2416775 Results: Change in BMD Access: full text; Table 2 and whole-body BMD results | Verified | Primary article Results: liraglutide alone and liraglutide plus exercise increased whole-body BMD versus placebo. This does not establish improved hip/spine BMD or fewer fractures. |
| L-wegovy | semaglutide Population not stated in this extraction Diabetes status not stated | label Comparator: n/a | Clinical fracture or BMD finding in six reviewed U.S. prescribing-information documents Clinical fracture or bone-density statement present? yes yes/no 95% CI not available in this extraction | Not available in this extraction | Not available in this extraction | Wegovy (semaglutide) U.S. prescribing information, revised 06/2026 Full prescribing information; clinical adverse reactions; search fracture, bone mineral, osteopor, hip, pelvis Access: full official prescribing information; relevant matches read; revision checked | Verified | Only label of six checked with a fracture statement. Searched for fracture, bone mineral density, osteoporosis, hip, pelvis. |
| S03-mash-pct | semaglutide Adults with MASH (liver disease) trial; median age 61 Not stated in label | label Comparator: Placebo | Any fracture Percent with a fracture 4.4 vs 3.3 % 95% CI not available in this extraction | Study group: 4.4% as reported; about 44.0 per 1,000 Comparator: 3.3% as reported; about 33.0 per 1,000 Difference: 11.0 per 1,000 as reported Counts and per-1,000 values are shown separately from model estimates. | Not available in this extraction | Wegovy (semaglutide) U.S. prescribing information, revised 06/2026 Access: Official PDF, text search | Verified | Separate trial and population from SELECT. |
| S03-mash-rate | semaglutide Adults with MASH (liver disease) trial Not stated in label | label Comparator: Placebo | Any fracture Cases per 100 patient-years 2.6 vs 2.0 per 100 patient-years 95% CI not available in this extraction | Not available in this extraction | Not available in this extraction | Wegovy (semaglutide) U.S. prescribing information, revised 06/2026 Access: Official PDF, text search | Verified | Rate per person-time, not per 1,000 people. |
| S04-all | semaglutide 17,604 adults 45+ with heart disease and BMI 27+ (8,803 vs 8,801) No diabetes | randomized_trial_or_secondary_analysis Comparator: Placebo | Reported fracture adverse events (broader MedDRA SOC grouping) Percent with a fracture 3.5 vs 3.6 % 95% CI not available in this extraction | Study group: 3.5% as reported; about 35.0 per 1,000 Comparator: 3.6% as reported; about 36.0 per 1,000 Difference: -1.0 per 1,000 as reported Counts and per-1,000 values are shown separately from model estimates. | Mean 39.8 months | Kushner RF et al. Safety profile of semaglutide versus placebo in the SELECT study. Obesity 2025;33(3):452-462 full text; fracture results and adverse-event collection methods Access: full text; fracture results and adverse-event collection methods | Verified | Narrower HLGT grouping: 1.5% vs 1.7%. Nonserious AEs outside specified collection categories were not systematically collected. Reported fracture-AE proportions, not exhaustive ascertainment of every fracture. Authors found no overall imbalance, with small numerical hip/pelvis imbalances in selected subgroups. |
| S05-direct | GLP-1 class 67,458 participants in mediation-analysis subset of the main T2D comparison Type 2 diabetes | observational Comparator: DPP-4 inhibitor | Fragility fracture Modelled direct-effect hazard ratio 0.81 HR 95% CI: 0.76 to 0.86 | Not available in this extraction | 3 years | Hamad CD et al. Glucagon-Like Peptide-1 Receptor Agonists and Fragility Fracture Risk in Type 2 Diabetes. JAMA Netw Open 2026;9(7):e2625141 Mediation analysis Access: full text; main and sensitivity analyses | Verified | Mediation analysis accounting for time-varying BMI and HbA1c; model assumptions apply; not proof of a biological mechanism. |
| S05-main | GLP-1 class 133,606 adults 50-90 with type 2 diabetes (66,803 per group) Type 2 diabetes | observational Comparator: DPP-4 inhibitor | Fragility fracture Hazard ratio 0.79 HR 95% CI: 0.76 to 0.83 | Not available in this extraction | 3 years | Hamad CD et al. Glucagon-Like Peptide-1 Receptor Agonists and Fragility Fracture Risk in Type 2 Diabetes. JAMA Netw Open 2026;9(7):e2625141 full text; main and sensitivity analyses Access: full text; main and sensitivity analyses | Verified | Investigators report adjusted absolute risk reduction 0.79% and NNT 126. These were not independently recalculated from patient data and do not equal a simple subtraction of crude event proportions. |
| S05-no-t2d | GLP-1 class Stratified cohort: 36,718 matched pairs without type 2 diabetes No diabetes | observational Comparator: Never-users of GLP-1 receptor agonists (noninitiators); not DPP-4 inhibitors | Fragility fracture Hazard ratio 1.13 HR 95% CI: 1.04 to 1.23 | Not available in this extraction | 3 years | Hamad CD et al. Glucagon-Like Peptide-1 Receptor Agonists and Fragility Fracture Risk in Type 2 Diabetes. JAMA Netw Open 2026;9(7):e2625141 Sensitivity analysis stratified by type 2 diabetes; three-year follow-up Access: full text; main and sensitivity analyses | Verified | Interaction P<.001. 1-year HR 1.02 (0.89-1.17). |
| S05-t2d | GLP-1 class Stratified cohort: 208,647 matched pairs with type 2 diabetes Type 2 diabetes | observational Comparator: Never-users of GLP-1 receptor agonists (noninitiators); not DPP-4 inhibitors | Fragility fracture Hazard ratio 0.91 HR 95% CI: 0.88 to 0.95 | Not available in this extraction | 3 years | Hamad CD et al. Glucagon-Like Peptide-1 Receptor Agonists and Fragility Fracture Risk in Type 2 Diabetes. JAMA Netw Open 2026;9(7):e2625141 Sensitivity analysis stratified by type 2 diabetes; three-year follow-up Access: full text; main and sensitivity analyses | Verified | Three-year sensitivity analysis versus GLP-1 noninitiators; interaction P<.001. No claim that diabetes itself causes protection. |
| S05-vert | GLP-1 class 133,606 adults 50-90 with type 2 diabetes (66,803 per group) Type 2 diabetes | observational Comparator: DPP-4 inhibitor | Vertebral fracture Hazard ratio 0.68 HR 95% CI: 0.63 to 0.73 | Not available in this extraction | 3 years | Hamad CD et al. Glucagon-Like Peptide-1 Receptor Agonists and Fragility Fracture Risk in Type 2 Diabetes. JAMA Netw Open 2026;9(7):e2625141 full text; main and sensitivity analyses Access: full text; main and sensitivity analyses | Verified | No row-specific note in this extraction |
| S05-year3 | GLP-1 class 133,606 adults 50-90 with type 2 diabetes (66,803 per group) Type 2 diabetes | observational Comparator: DPP-4 inhibitor | Fragility fracture Hazard ratio 0.94 HR 95% CI: 0.86 to 1.02 | Not available in this extraction | Third-year interval of follow-up; not the cumulative three-year estimate | Hamad CD et al. Glucagon-Like Peptide-1 Receptor Agonists and Fragility Fracture Risk in Type 2 Diabetes. JAMA Netw Open 2026;9(7):e2625141 Interval-specific analysis and Figure 2 Access: full text; main and sensitivity analyses | Verified | Primary paper Figure 2 / interval analysis; confidence interval includes 1.0. Main cumulative three-year HR remains 0.79. |
| S06-no-t2d-nb | semaglutide People with obesity without type 2 diabetes (10,323-56,225 matched pairs per comparison) No diabetes | observational Comparator: Naltrexone/bupropion | Major osteoporotic fracture Hazard ratio 0.75 HR 95% CI: 0.46 to 1.22 | Study group: 30 of 10,141; 3.0 per 1,000 Comparator: 35 of 10,114; 3.5 per 1,000 Difference: -0.5 per 1,000 as reported Counts and per-1,000 values are shown separately from model estimates. | 2 years | Huang YN et al. Associations of Semaglutide With Skeletal Outcomes in People With Obesity, With and Without Type 2 Diabetes. Diabetes Obes Metab 2026;28(7):5834-5847 Table 1 (T2D) or Table 2 (without T2D) Access: full text; Tables 1 and 2 | Verified | Raw P=.240; BH-adjusted P=.784. Event-specific denominators from source table. Count-derived proportions differ from time-to-event estimates; do not call them Kaplan-Meier risks. |
| S06-no-t2d-ph | semaglutide People with obesity without type 2 diabetes (10,323-56,225 matched pairs per comparison) No diabetes | observational Comparator: Phentermine | Major osteoporotic fracture Hazard ratio 1.13 HR 95% CI: 0.84 to 1.51 | Study group: 92 of 36,229; 2.5 per 1,000 Comparator: 85 of 36,205; 2.3 per 1,000 Difference: 0.2 per 1,000 as reported Counts and per-1,000 values are shown separately from model estimates. | 2 years | Huang YN et al. Associations of Semaglutide With Skeletal Outcomes in People With Obesity, With and Without Type 2 Diabetes. Diabetes Obes Metab 2026;28(7):5834-5847 Table 1 (T2D) or Table 2 (without T2D) Access: full text; Tables 1 and 2 | Verified | Raw P=.433; BH-adjusted P=.927. Event-specific denominators from source table. Count-derived proportions differ from time-to-event estimates; do not call them Kaplan-Meier risks. |
| S06-no-t2d-pt | semaglutide People with obesity without type 2 diabetes (10,323-56,225 matched pairs per comparison) No diabetes | observational Comparator: Phentermine/topiramate | Major osteoporotic fracture Hazard ratio 1.35 HR 95% CI: 0.81 to 2.25 | Study group: 37 of 10,689; 3.5 per 1,000 Comparator: 25 of 10,686; 2.3 per 1,000 Difference: 1.1 per 1,000 as reported Counts and per-1,000 values are shown separately from model estimates. | 2 years | Huang YN et al. Associations of Semaglutide With Skeletal Outcomes in People With Obesity, With and Without Type 2 Diabetes. Diabetes Obes Metab 2026;28(7):5834-5847 Table 1 (T2D) or Table 2 (without T2D) Access: full text; Tables 1 and 2 | Verified | Raw P=.242; BH-adjusted P=.348. Event-specific denominators from source table. Count-derived proportions differ from time-to-event estimates; do not call them Kaplan-Meier risks. |
| S06-no-t2d-usual | semaglutide People with obesity without type 2 diabetes (10,323-56,225 matched pairs per comparison) No diabetes | observational Comparator: Usual care: metformin users without semaglutide or comparator-drug initiation | Major osteoporotic fracture Hazard ratio 0.93 HR 95% CI: 0.73 to 1.18 | Study group: 139 of 55,428; 2.5 per 1,000 Comparator: 135 of 55,434; 2.4 per 1,000 Difference: 0.1 per 1,000 as reported Counts and per-1,000 values are shown separately from model estimates. | 2 years | Huang YN et al. Associations of Semaglutide With Skeletal Outcomes in People With Obesity, With and Without Type 2 Diabetes. Diabetes Obes Metab 2026;28(7):5834-5847 Table 1 (T2D) or Table 2 (without T2D) Access: full text; Tables 1 and 2 | Verified | Raw and adjusted P=.540. Event-specific denominators from source table. Count-derived proportions differ from time-to-event estimates; do not call them Kaplan-Meier risks. |
| S06-t2d-empa | semaglutide People with obesity and type 2 diabetes (19,824-93,519 matched pairs per comparison) Type 2 diabetes | observational Comparator: Empagliflozin | Major osteoporotic fracture Hazard ratio 0.69 HR 95% CI: 0.61 to 0.77 | Study group: 441 of 46,215; 9.5 per 1,000 Comparator: 615 of 46,150; 13.3 per 1,000 Difference: -3.8 per 1,000 as reported Counts and per-1,000 values are shown separately from model estimates. | 3 years | Huang YN et al. Associations of Semaglutide With Skeletal Outcomes in People With Obesity, With and Without Type 2 Diabetes. Diabetes Obes Metab 2026;28(7):5834-5847 full text; Tables 1 and 2 Access: full text; Tables 1 and 2 | Verified | Significant after Benjamini-Hochberg false-discovery-rate correction. Event-specific denominators from source table. Count-derived proportions differ from time-to-event estimates; do not call them Kaplan-Meier risks. |
| S06-t2d-glip | semaglutide People with obesity and type 2 diabetes; separate propensity-matched comparison; outcome-eligible counts shown in denominator columns Type 2 diabetes | observational Comparator: Glipizide | Major osteoporotic fracture Hazard ratio 0.72 HR 95% CI: 0.63 to 0.83 | Study group: 340 of 31,766; 10.7 per 1,000 Comparator: 484 of 31,812; 15.2 per 1,000 Difference: -4.5 per 1,000 as reported Counts and per-1,000 values are shown separately from model estimates. | 3 years | Huang YN et al. Associations of Semaglutide With Skeletal Outcomes in People With Obesity, With and Without Type 2 Diabetes. Diabetes Obes Metab 2026;28(7):5834-5847 full text; Tables 1 and 2 Access: full text; Tables 1 and 2 | Verified | Significant after Benjamini-Hochberg false-discovery-rate correction. Event-specific denominators from source table. Count-derived proportions differ from time-to-event estimates; do not call them Kaplan-Meier risks. |
| S06-t2d-sita | semaglutide People with obesity and type 2 diabetes (19,824-93,519 matched pairs per comparison) Type 2 diabetes | observational Comparator: Sitagliptin | Major osteoporotic fracture Hazard ratio 0.84 HR 95% CI: 0.70 to 0.99 | Study group: 226 of 19,267; 11.7 per 1,000 Comparator: 290 of 19,315; 15.0 per 1,000 Difference: -3.3 per 1,000 as reported Counts and per-1,000 values are shown separately from model estimates. | 3 years | Huang YN et al. Associations of Semaglutide With Skeletal Outcomes in People With Obesity, With and Without Type 2 Diabetes. Diabetes Obes Metab 2026;28(7):5834-5847 Table 1 (T2D) or Table 2 (without T2D) Access: full text; Tables 1 and 2 | Verified | Raw P=.045; false-discovery-rate-adjusted P=.113. Not significant after correction. Event-specific denominators from source table. Count-derived proportions differ from time-to-event estimates; do not call them Kaplan-Meier risks. |
| S06-t2d-usual | semaglutide People with obesity and type 2 diabetes; separate propensity-matched comparison; outcome-eligible counts shown in denominator columns Type 2 diabetes | observational Comparator: Usual care: metformin users without semaglutide or comparator-drug initiation | Major osteoporotic fracture Hazard ratio 0.84 HR 95% CI: 0.76 to 0.93 | Study group: 763 of 91,468; 8.3 per 1,000 Comparator: 952 of 91,607; 10.4 per 1,000 Difference: -2.1 per 1,000 as reported Counts and per-1,000 values are shown separately from model estimates. | 3 years | Huang YN et al. Associations of Semaglutide With Skeletal Outcomes in People With Obesity, With and Without Type 2 Diabetes. Diabetes Obes Metab 2026;28(7):5834-5847 full text; Tables 1 and 2 Access: full text; Tables 1 and 2 | Verified | Significant after Benjamini-Hochberg false-discovery-rate correction. Event-specific denominators from source table. Count-derived proportions differ from time-to-event estimates; do not call them Kaplan-Meier risks. |
| S07-sema | semaglutide Adults 65+ with type 2 diabetes and BMI 25+ Type 2 diabetes | observational Comparator: DPP-4 inhibitor | Femoral fracture Hazard ratio 0.488 HR 95% CI: 0.367 to 0.649 | Study group: 70 of 27,896; 2.5 per 1,000 Comparator: 145 of 27,896; 5.2 per 1,000 Difference: -2.7 per 1,000 as reported Counts and per-1,000 values are shown separately from model estimates. | 1 year | Chen HY et al. Lower fall and femoral fracture risks with semaglutide and tirzepatide compared with DPP-4 inhibitors in older adults with type 2 diabetes. Osteoporos Int 2026 full text; results and eligibility methods Access: full text; results and eligibility methods | Verified | 27,896 per arm explicitly reported by the investigators, not inferred from rounded percentages. Reported NNT 372 is not a causal treatment recommendation. Continued prescriptions at 6-12 months required; selected cohort excludes recent falls/fractures/frailty/sarcopenia. |
| S07-sema-falls | semaglutide Adults 65+ with type 2 diabetes and BMI 25+ Type 2 diabetes | observational Comparator: DPP-4 inhibitor | Falls Hazard ratio 0.663 HR 95% CI: 0.612 to 0.718 | Not available in this extraction | 1 year | Chen HY et al. Lower fall and femoral fracture risks with semaglutide and tirzepatide compared with DPP-4 inhibitors in older adults with type 2 diabetes. Osteoporos Int 2026 full text; results and eligibility methods Access: full text; results and eligibility methods | Verified | 3.6% vs 5.4%. |
| S07-tirz | tirzepatide Adults 65+ with type 2 diabetes and BMI 25+ Type 2 diabetes | observational Comparator: DPP-4 inhibitor | Femoral fracture Hazard ratio 0.452 HR 95% CI: 0.28 to 0.729 | Study group: 24 of 12,808; 1.9 per 1,000 Comparator: 56 of 12,808; 4.4 per 1,000 Difference: -2.5 per 1,000 as reported Counts and per-1,000 values are shown separately from model estimates. | 1 year | Chen HY et al. Lower fall and femoral fracture risks with semaglutide and tirzepatide compared with DPP-4 inhibitors in older adults with type 2 diabetes. Osteoporos Int 2026 full text; results and eligibility methods Access: full text; results and eligibility methods | Verified | 12,808 per arm explicitly reported. Separate comparison, not head-to-head semaglutide versus tirzepatide. Reported NNT 400 is observational. Continued prescriptions at 6-12 months required; prior falls/fractures/frailty/sarcopenia excluded. |
| S07-tirz-falls | tirzepatide Adults 65+ with type 2 diabetes and BMI 25+ Type 2 diabetes | observational Comparator: DPP-4 inhibitor | Falls Hazard ratio 0.664 HR 95% CI: 0.591 to 0.747 | Not available in this extraction | 1 year | Chen HY et al. Lower fall and femoral fracture risks with semaglutide and tirzepatide compared with DPP-4 inhibitors in older adults with type 2 diabetes. Osteoporos Int 2026 full text; results and eligibility methods Access: full text; results and eligibility methods | Verified | 462 (3.6%) vs 728 (5.7%). |
| S08-main | GLP-1 class 46,177 adults 65+ with type 2 diabetes in Israel (11,257 GLP-1 users; 34,920 comparator users) Type 2 diabetes | observational Comparator: SGLT-2 inhibitors or DPP-4 inhibitors | First fragility fracture Hazard ratio 1.11 HR 95% CI: 1.01 to 1.21 | Not available in this extraction | Median 34.7 months | Kasher Meron M et al. GLP-1 receptor agonists and the risk of fragility fractures in older adults with type 2 diabetes. J Clin Endocrinol Metab 2026;111(7):1949-1958 original published abstract Access: original published abstract | Verified | 4,086 (8.8%) had a fragility fracture overall. |
| S09-tx | tirzepatide Adults with type 2 diabetes or obesity starting tirzepatide or another GLP-1 (66,329 per matched group) Mixed (type 2 diabetes or obesity) | observational Comparator: Other GLP-1 drugs | Starting osteoporosis medicine Hazard ratio 1.61 HR 95% CI: 1.22 to 2.12 | Not available in this extraction | 14 months | Hsu YH et al. Association of tirzepatide use with risk of osteoporosis compared with other GLP-1 receptor agonists. Diabetes Res Clin Pract 2025;230:112995 original publisher abstract and preview; full article not accessible Access: original publisher abstract and preview; full article not accessible | Verified | Only the principal tirzepatide-versus-other-GLP-1 comparison has 66,329 per arm stated in the accessible abstract; other comparator counts not assumed. |
| S10-dm | semaglutide or tirzepatide (combined) Subgroup with diabetes diabetes (type not specified in accessible abstract) | observational Comparator: Matched non-users with repeat DXA | Total hip BMD, annualized change Direction similar between groups 95% CI not available in this extraction | Not available in this extraction | Median 17 months | Liu Y et al. Skeletal effect of semaglutide and tirzepatide in patients with increased risk of fractures. J Clin Endocrinol Metab 2026;111(7):1959-1966 original publisher abstract Access: original publisher abstract | Verified | No row-specific note in this extraction |
| S10-no-dm | semaglutide or tirzepatide (combined) Subgroup without diabetes No diabetes | observational Comparator: Matched non-users with repeat DXA | Total hip BMD, annualized change Annualized % change, users vs controls -1.0 vs -0.6 %/year 95% CI not available in this extraction | Not available in this extraction | Median 17 months | Liu Y et al. Skeletal effect of semaglutide and tirzepatide in patients with increased risk of fractures. J Clin Endocrinol Metab 2026;111(7):1959-1966 original publisher abstract Access: original publisher abstract | Verified | Annualized total-hip BMD change: -1.0% in mixed semaglutide/tirzepatide users versus -0.6% in controls, P=.04. The original abstract reports a negative control value. Neither result is drug-specific. |
| S10-overall | semaglutide or tirzepatide (combined) 255 users and 255 controls with increased fracture risk (92% women, mean age 64) Mixed | observational Comparator: Matched non-users with repeat DXA | Total hip and femoral neck BMD Direction both groups declined; similar size 95% CI not available in this extraction | Not available in this extraction | Median 17 months | Liu Y et al. Skeletal effect of semaglutide and tirzepatide in patients with increased risk of fractures. J Clin Endocrinol Metab 2026;111(7):1959-1966 original publisher abstract Access: original publisher abstract | Verified | Median 5% weight loss in users; more weight loss tied to more hip bone loss (r=0.32). |
| S11-no-dm | GLP-1 class Adults without diabetes who kept a stable weight (full cohort 380,438) No diabetes | conference_or_research_brief Comparator: Other weight-loss medication users with stable weight | Osteoporosis diagnosis or osteoporosis medicine order Investigator-reported relative hazard difference (Cox analysis) 22.0 % 95% CI not available in this extraction | Not available in this extraction | Index 2017-01-01 to 2024-10-31; follow-up through 2025-04-01; time-varying stable-weight stratum (-2% to +2%) | Epic Research. GLP-1 Use Associated with Lower Osteoporosis Risk in Adults with Type 2 Diabetes but Higher Risk in Adults Without Diabetes original research brief, data definitions and PDF text; figure CIs not numerically extracted Access: original research brief, data definitions and PDF text; figure CIs not numerically extracted | Verified | Confidence limits not extracted. Stable-weight subgroup, age 30+. Outcome includes diagnosis OR osteoporosis medicine order. Exact subgroup counts and numeric confidence bounds were not extracted; do not use whole-cohort counts as subgroup denominators. |
| S11-t2d | GLP-1 class Adults with type 2 diabetes who kept a stable weight (full cohort ~2 million) Type 2 diabetes | conference_or_research_brief Comparator: Stable-weight non-users | Osteoporosis diagnosis or osteoporosis medicine order Investigator-reported relative hazard difference (Cox analysis) -8.7 % 95% CI not available in this extraction | Not available in this extraction | Index 2017-01-01 to 2024-10-31; follow-up through 2025-04-01; time-varying stable-weight stratum (-2% to +2%) | Epic Research. GLP-1 Use Associated with Lower Osteoporosis Risk in Adults with Type 2 Diabetes but Higher Risk in Adults Without Diabetes original research brief, data definitions and PDF text; figure CIs not numerically extracted Access: original research brief, data definitions and PDF text; figure CIs not numerically extracted | Verified | Stable-weight subgroup, age 30+. Outcome includes diagnosis OR osteoporosis medicine order. Exact subgroup counts and numeric confidence bounds were not extracted; do not use whole-cohort counts as subgroup denominators. |
| S12-78-88 | GLP-1 class Age 78-88 subgroup of overweight/obesity cohort without diabetes; subgroup size not supplied in accessible abstract No diabetes | observational Comparator: Matched non-users | Any fracture diagnosis Odds ratio 4.99 OR 95% CI: 2.68 to 9.26 | Study group: 9.28% as reported; about 92.8 per 1,000 Comparator: 5.10% as reported; about 51.0 per 1,000 Difference: 41.8 per 1,000 as reported Counts and per-1,000 values are shown separately from model estimates. | 1 year | Constantine E et al. The Impact of Glucagon-Like Peptide-1 Receptor Agonists on Fracture Risk in Overweight or Obese, Nondiabetic Patients. J Am Acad Orthop Surg 2026;34(12):e1610-e1619 original published abstract; full text inaccessible Access: original published abstract; full text inaccessible | verified as reported in primary abstract; numerical relationship unresolved | Reported proportions 9.28% vs 5.10%; reported OR 4.99 (2.68-9.26), reported NNH 24. The crude odds ratio from these rounded proportions is about 1.90, not 4.99. Full-text model details inaccessible; do not silently reconcile. |
| S12-bmi40 | GLP-1 class Subgroup BMI 40+ No diabetes | observational Comparator: Matched non-users | Any fracture diagnosis Odds ratio 1.26 OR 95% CI: 1.04 to 1.52 | Study group: 3.15% as reported; about 31.5 per 1,000 Comparator: 1.91% as reported; about 19.1 per 1,000 Difference: 12.4 per 1,000 as reported Counts and per-1,000 values are shown separately from model estimates. | 1 year | Constantine E et al. The Impact of Glucagon-Like Peptide-1 Receptor Agonists on Fracture Risk in Overweight or Obese, Nondiabetic Patients. J Am Acad Orthop Surg 2026;34(12):e1610-e1619 original published abstract; full text inaccessible Access: original published abstract; full text inaccessible | verified as reported in primary abstract; numerical relationship unresolved | Reported proportions 3.15% vs 1.91%; reported OR 1.26 (1.04-1.52). The crude odds ratio from those proportions is about 1.67, not 1.26. Model-to-estimate mapping not independently verified. |
| S12-main | GLP-1 class Adults with overweight or obesity, no diabetes, no fragility-fracture risk factors (33,210 per matched group) No diabetes | observational Comparator: Matched non-users | Any fracture diagnosis Risk ratio 1.09 RR 95% CI: 1.04 to 1.14 | Study group: 3.05% as reported; about 30.5 per 1,000 Comparator: 2.61% as reported; about 26.1 per 1,000 Difference: 4.4 per 1,000 as reported Counts and per-1,000 values are shown separately from model estimates. | 1 year | Constantine E et al. The Impact of Glucagon-Like Peptide-1 Receptor Agonists on Fracture Risk in Overweight or Obese, Nondiabetic Patients. J Am Acad Orthop Surg 2026;34(12):e1610-e1619 original published abstract; full text inaccessible Access: original published abstract; full text inaccessible | verified as reported in primary abstract; numerical relationship unresolved | Reported proportions 3.05% vs 2.61%; reported RR 1.09 (1.04-1.14), reported OR 1.19 (1.09-1.31), reported NNH 227. Crude ratio of rounded proportions is 1.1686, not 1.09. Full-text model-to-estimate mapping could not be verified. Preserve as investigator-reported; do not call it a recomputed or verified adjusted RR. |
| S13-osteomalacia | GLP-1 class Adults with type 2 diabetes and obesity (73,483 per matched cohort) Type 2 diabetes | conference_or_research_brief Comparator: Matched non-users | Osteomalacia diagnosis Relative risk 2.55 RR 95% CI: 1.83 to 3.55 | Study group: 0.2% as reported; about 2.0 per 1,000 Comparator: 0.1% as reported; about 1.0 per 1,000 Difference: 1.0 per 1,000 as reported Counts and per-1,000 values are shown separately from model estimates. | 5 years | Wajahath et al. GLP-1 Receptor Agonist Use is Associated with Increased Risk of Osteoporosis, Gout, and Osteomalacia: A Retrospective Cohort Analysis original conference abstract and Table 1 (PDF visually checked); September investigator report Access: original conference abstract and Table 1 (PDF visually checked); September investigator report | verified as printed in primary conference abstract; percentages and full-cohort counts do not reconcile | 0.2% vs 0.1%; rare. Percentages copied as reported, not recomputed incidence. Original abstract Table 1 supplies counts that do not reproduce the printed osteoporosis percentages using the full matched n=73,483 per arm. Separate count-check records preserve that conflict. |
| S13-osteoporosis | GLP-1 class Adults with type 2 diabetes and obesity (73,483 per matched cohort) Type 2 diabetes | conference_or_research_brief Comparator: Matched non-users | Osteoporosis diagnosis Relative risk 1.29 RR 95% CI: 1.22 to 1.36 | Study group: 4.1% as reported; about 41.0 per 1,000 Comparator: 3.2% as reported; about 32.0 per 1,000 Difference: 9.0 per 1,000 as reported Counts and per-1,000 values are shown separately from model estimates. | 5 years | Wajahath et al. GLP-1 Receptor Agonist Use is Associated with Increased Risk of Osteoporosis, Gout, and Osteomalacia: A Retrospective Cohort Analysis original conference abstract and Table 1 (PDF visually checked); September investigator report Access: original conference abstract and Table 1 (PDF visually checked); September investigator report | verified as printed in primary conference abstract; percentages and full-cohort counts do not reconcile | 4.1% vs 3.2%. Authors: association, not causation; absolute differences under one percentage point for most outcomes. Percentages copied as reported, not recomputed incidence. Original abstract Table 1 supplies counts that do not reproduce the printed osteoporosis percentages using the full matched n=73,483 per arm. Separate count-check records preserve that conflict. |
| S14-lira | liraglutide Liraglutide subgroup of 38-trial meta-analysis (39,795 participants overall); subgroup sample size not extracted Type 2 diabetes | meta_analysis Comparator: Placebo or other diabetes drugs | Bone fracture Odds ratio 0.56 OR 95% CI: 0.38 to 0.81 | Not available in this extraction | Not available in this extraction | Cheng L et al. Glucagon-like peptide-1 receptor agonists and risk of bone fracture in patients with type 2 diabetes: a meta-analysis of randomized controlled trials. Diabetes Metab Res Rev 2019;35(7):e3168 original publisher abstract; full results not accessible Access: original publisher abstract; full results not accessible | Verified | Drug-specific meta-analysis subgroup. Do not infer a ranking against other agents. Primary abstract; not independently re-pooled. |
| S14-main | GLP-1 class 38 randomized trials, 39,795 people with type 2 diabetes Type 2 diabetes | meta_analysis Comparator: Placebo or other diabetes drugs | Bone fracture Odds ratio 0.71 OR 95% CI: 0.56 to 0.91 | Not available in this extraction | Not available in this extraction | Cheng L et al. Glucagon-like peptide-1 receptor agonists and risk of bone fracture in patients with type 2 diabetes: a meta-analysis of randomized controlled trials. Diabetes Metab Res Rev 2019;35(7):e3168 original publisher abstract; full results not accessible Access: original publisher abstract; full results not accessible | Verified | 38 randomized trials; 39,795 participants; 241 fracture cases (107 GLP-1, 134 comparator). Liraglutide OR 0.56 (0.38-0.81); lixisenatide 0.55 (0.31-0.97). Search through 2018-02-28. Statistically significant duration subgroup was >52 weeks; this does not prove a minimum time-to-benefit for an individual. |
| S15-bmd | tirzepatide Adults 65+ pooled across SURMOUNT-1 to -5, SURMOUNT-OSA and SUMMIT safety sets (586 tirzepatide, 340 placebo) Mixed | randomized_trial_or_secondary_analysis Comparator: Placebo | Bone mineral density Measured? not assessed in the phase 3 trials 95% CI not available in this extraction | Not available in this extraction | Pooled trials with differing durations (52, 72, 88 or 176-week endpoints); not a common one-year risk | Alfaris N et al. Tirzepatide for Obesity in Adults 65 Years or Older: A Post Hoc Analysis of the SURMOUNT and SUMMIT Clinical Trials. Diabetes Obes Metab 2026;28(9) full text; Table 1 and discussion Access: full text; Table 1 and discussion | Verified | Authors: fracture comparison limited by no BMD assessments and follow-up that may be too short. Sparse events; categories can overlap. Descriptive pooled safety results; not a head-to-head bone-density trial; categories may overlap; Lilly-funded. |
| S15-falls | tirzepatide Adults 65+ pooled across SURMOUNT-1 to -5, SURMOUNT-OSA and SUMMIT safety sets (586 tirzepatide, 340 placebo) Mixed | randomized_trial_or_secondary_analysis Comparator: Placebo | Falls Participants with adverse event Not available in this extraction | Study group: 21 of 586; 35.8 per 1,000 Comparator: 12 of 340; 35.3 per 1,000 Difference: 0.5 per 1,000 as reported Counts and per-1,000 values are shown separately from model estimates. | Pooled trials with differing durations (52, 72, 88 or 176-week endpoints); not a common one-year risk | Alfaris N et al. Tirzepatide for Obesity in Adults 65 Years or Older: A Post Hoc Analysis of the SURMOUNT and SUMMIT Clinical Trials. Diabetes Obes Metab 2026;28(9) full text; Table 1 and discussion Access: full text; Table 1 and discussion | Verified | Printed as 3.6% vs 3.5%. Descriptive pooled safety results; not a head-to-head bone-density trial; categories may overlap; Lilly-funded. |
| S15-hip | tirzepatide Adults 65+ pooled across SURMOUNT-1 to -5, SURMOUNT-OSA and SUMMIT safety sets (586 tirzepatide, 340 placebo) Mixed | randomized_trial_or_secondary_analysis Comparator: Placebo | Hip fracture Participants with adverse event Not available in this extraction | Study group: 0 of 586; 0.0 per 1,000 Comparator: 1 of 340; 2.9 per 1,000 Difference: -2.9 per 1,000 as reported Counts and per-1,000 values are shown separately from model estimates. | Pooled trials with differing durations (52, 72, 88 or 176-week endpoints); not a common one-year risk | Alfaris N et al. Tirzepatide for Obesity in Adults 65 Years or Older: A Post Hoc Analysis of the SURMOUNT and SUMMIT Clinical Trials. Diabetes Obes Metab 2026;28(9) full text; Table 1 and discussion Access: full text; Table 1 and discussion | Verified | Descriptive pooled safety results; not a head-to-head bone-density trial; categories may overlap; Lilly-funded. |
| S15-limb | tirzepatide Adults 65+ pooled across SURMOUNT-1 to -5, SURMOUNT-OSA and SUMMIT safety sets (586 tirzepatide, 340 placebo) Mixed | randomized_trial_or_secondary_analysis Comparator: Placebo | Limb fracture (any) Participants with adverse event Not available in this extraction | Study group: 9 of 586; 15.4 per 1,000 Comparator: 11 of 340; 32.4 per 1,000 Difference: -17.0 per 1,000 as reported Counts and per-1,000 values are shown separately from model estimates. | Pooled trials with differing durations (52, 72, 88 or 176-week endpoints); not a common one-year risk | Alfaris N et al. Tirzepatide for Obesity in Adults 65 Years or Older: A Post Hoc Analysis of the SURMOUNT and SUMMIT Clinical Trials. Diabetes Obes Metab 2026;28(9) full text; Table 1 and discussion Access: full text; Table 1 and discussion | Verified | Descriptive pooled safety results; not a head-to-head bone-density trial; categories may overlap; Lilly-funded. |
| S15-spinal | tirzepatide Adults 65+ pooled across SURMOUNT-1 to -5, SURMOUNT-OSA and SUMMIT safety sets (586 tirzepatide, 340 placebo) Mixed | randomized_trial_or_secondary_analysis Comparator: Placebo | Spinal fracture (any) Participants with adverse event Not available in this extraction | Study group: 5 of 586; 8.5 per 1,000 Comparator: 1 of 340; 2.9 per 1,000 Difference: 5.6 per 1,000 as reported Counts and per-1,000 values are shown separately from model estimates. | Pooled trials with differing durations (52, 72, 88 or 176-week endpoints); not a common one-year risk | Alfaris N et al. Tirzepatide for Obesity in Adults 65 Years or Older: A Post Hoc Analysis of the SURMOUNT and SUMMIT Clinical Trials. Diabetes Obes Metab 2026;28(9) full text; Table 1 and discussion Access: full text; Table 1 and discussion | Verified | Descriptive pooled safety results; not a head-to-head bone-density trial; categories may overlap; Lilly-funded. |
| S15-thoracic | tirzepatide Adults 65+ pooled across SURMOUNT-1 to -5, SURMOUNT-OSA and SUMMIT safety sets (586 tirzepatide, 340 placebo) Mixed | randomized_trial_or_secondary_analysis Comparator: Placebo | Thoracic cage fracture Participants with adverse event Not available in this extraction | Study group: 2 of 586; 3.4 per 1,000 Comparator: 4 of 340; 11.8 per 1,000 Difference: -8.4 per 1,000 as reported Counts and per-1,000 values are shown separately from model estimates. | Pooled trials with differing durations (52, 72, 88 or 176-week endpoints); not a common one-year risk | Alfaris N et al. Tirzepatide for Obesity in Adults 65 Years or Older: A Post Hoc Analysis of the SURMOUNT and SUMMIT Clinical Trials. Diabetes Obes Metab 2026;28(9) full text; Table 1 and discussion Access: full text; Table 1 and discussion | Verified | Descriptive pooled safety results; not a head-to-head bone-density trial; categories may overlap; Lilly-funded. |
| L-ozempic | semaglutide Population not stated in this extraction Diabetes status not stated | label Comparator: n/a | Clinical fracture or BMD finding in six reviewed U.S. prescribing-information documents Clinical fracture or bone-density statement present? No clinical fracture/BMD statement located in reviewed edition yes/no 95% CI not available in this extraction | Not available in this extraction | Not available in this extraction | Ozempic U.S. prescribing information, revised 05/2026 Full prescribing information; clinical adverse reactions; search fracture, bone mineral, osteopor, hip, pelvis Access: full official prescribing information; relevant matches read; revision checked | Verified | Same drug as Wegovy; no clinical fracture or bone-density statement found. |
| L-mounjaro | tirzepatide Population not stated in this extraction Diabetes status not stated | label Comparator: n/a | Clinical fracture or BMD finding in six reviewed U.S. prescribing-information documents Clinical fracture or bone-density statement present? No clinical fracture/BMD statement located in reviewed edition yes/no 95% CI not available in this extraction | Not available in this extraction | Not available in this extraction | Mounjaro (tirzepatide) U.S. prescribing information, revised 08/2026 Full prescribing information; clinical adverse reactions; search fracture, bone mineral, osteopor, hip, pelvis Access: full official prescribing information; relevant matches read; revision checked | Verified | Revision 8/2026 verified in DailyMed version updated August 27, 2026. Manufacturer PDF text and screenshot returned different cached revisions; DailyMed edition used. |
| L-zepbound | tirzepatide Population not stated in this extraction Diabetes status not stated | label Comparator: n/a | Clinical fracture or BMD finding in six reviewed U.S. prescribing-information documents Clinical fracture or bone-density statement present? No clinical fracture/BMD statement located in reviewed edition yes/no 95% CI not available in this extraction | Not available in this extraction | Not available in this extraction | Zepbound (tirzepatide) U.S. prescribing information, revised 08/2026 Full prescribing information; clinical adverse reactions; search fracture, bone mineral, osteopor, hip, pelvis Access: full official prescribing information; relevant matches read; revision checked | Verified | No clinical fracture/BMD statement found. Nonclinical bone-marrow testing and peptide-backbone text are not patient bone outcomes. |
| L-saxenda | liraglutide Population not stated in this extraction Diabetes status not stated | label Comparator: n/a | Clinical fracture or BMD finding in six reviewed U.S. prescribing-information documents Clinical fracture or bone-density statement present? No clinical fracture/BMD statement located in reviewed edition yes/no 95% CI not available in this extraction | Not available in this extraction | Not available in this extraction | Saxenda (liraglutide) U.S. prescribing information, revised 02/2026 Full prescribing information; clinical adverse reactions; search fracture, bone mineral, osteopor, hip, pelvis Access: full official prescribing information; relevant matches read; revision checked | Verified | No clinical fracture/BMD statement found. Pelvis matches describe fetal animal findings, not adult fracture outcomes. |
| L-foundayo | orforglipron Population not stated in this extraction Diabetes status not stated | label Comparator: n/a | Clinical fracture or BMD finding in six reviewed U.S. prescribing-information documents Clinical fracture or bone-density statement present? No clinical fracture/BMD statement located in reviewed edition yes/no 95% CI not available in this extraction | Not available in this extraction | Not available in this extraction | Foundayo (orforglipron) U.S. prescribing information, revised 04/2026 Full prescribing information; clinical adverse reactions; search fracture, bone mineral, osteopor, hip, pelvis Access: full official prescribing information; relevant matches read; revision checked | Verified | No row-specific note in this extraction |
| S21-bmc | liraglutide 37 healthy women with obesity after about 12% diet-induced weight loss; mean age 46; no diabetes in cited trial context no diabetes | randomized_trial_or_secondary_analysis Comparator: Weight-maintenance control without liraglutide | Bone mineral content (BMC); total and arm-leg results described in abstract Between-group difference in bone mineral content loss 27 g 95% CI: 5 to 48 | Not available in this extraction | 52 weeks after initial weight loss | Iepsen et al. GLP-1 Receptor Agonist Treatment Increases Bone Formation and Prevents Bone Loss in Weight-Reduced Obese Women Abstract: Participants, Intervention, Main outcome measures and Results Access: original published abstract; verified again in author institution repository | verified from primary source | P=.01. Bone mineral content is not bone mineral density or fracture risk. 27 g is a treatment difference in BMC loss, not the amount of bone added. |
| S22-diet-hip | No GLP-1 (diet/exercise context) 48 adults (30 women, 18 men); mean age 57; BMI 27; diet n=19, exercise n=19, control n=10 not used to classify GLP-1 evidence | randomized_trial_or_secondary_analysis Comparator: Healthy-lifestyle control | Total hip BMD change from baseline Reported within-group percentage change, not placebo-adjusted semaglutide result -2.2 vs +1.2 % 95% CI not available in this extraction | Not available in this extraction | 1 year | Villareal et al. Bone mineral density response to caloric restriction-induced weight loss or exercise-induced weight loss: a randomized controlled trial Abstract: Methods and Results Access: original published abstract | verified from primary source | Diet hip BMD -2.2% (SD 3.1) versus control +1.2% (SD 2.1), P=.02. Diet weight change -10.7% (SD 6.3). SD is not a confidence interval. Not a head-to-head GLP-1 comparison. |
| Study-level summary — not an additional comparator-specific result | ||||||||
| S06-no-t2d | semaglutide People with obesity without type 2 diabetes (10,323-56,225 matched pairs per comparison) No diabetes | observational Comparator: Naltrexone/bupropion, phentermine/topiramate, phentermine, or usual care (metformin without semaglutide/comparator initiation); separate matches | Major osteoporotic fracture Hazard ratio no significant association (all p>0.05) HR 95% CI not available in this extraction | Not available in this extraction | 2 years | Huang YN et al. Associations of Semaglutide With Skeletal Outcomes in People With Obesity, With and Without Type 2 Diabetes. Diabetes Obes Metab 2026;28(7):5834-5847 full text; Tables 1 and 2 Access: full text; Tables 1 and 2 | Verified | Four separate two-year MOF comparisons in Table 2; none statistically significant. Detailed records added separately. Not the same comparators or follow-up as the diabetes cohort. |
| Related: combined osteoporosis-or-fracture outcomes (not fracture-only) | ||||||||
| S03-75plus | semaglutide SELECT participants aged 75+ No diabetes | label Comparator: Placebo | Hip or pelvis fracture Participants with hip or pelvis fracture Not available in this extraction | Study group: 17 of 703; 24.2 per 1,000 Comparator: 4 of 663; 6.0 per 1,000 Difference: 18.1 per 1,000 as reported Counts and per-1,000 values are shown separately from model estimates. | SELECT trial period; overall median follow-up 41.8 months (label), mean 39.8 months (safety paper); not yearly rates | Wegovy (semaglutide) U.S. prescribing information, revised 06/2026 Access: Official PDF, text search | Verified | Ratio 4.01x. Trial-period proportion, not a yearly rate. Numerators count participants with at least one qualifying fracture, not all fracture events. |
| S03-women | semaglutide Women in SELECT No diabetes | label Comparator: Placebo | Hip or pelvis fracture Participants with hip or pelvis fracture Not available in this extraction | Study group: 24 of 2,448; 9.8 per 1,000 Comparator: 5 of 2,424; 2.1 per 1,000 Difference: 7.7 per 1,000 as reported Counts and per-1,000 values are shown separately from model estimates. | SELECT trial period; overall median follow-up 41.8 months (label), mean 39.8 months (safety paper); not yearly rates | Wegovy (semaglutide) U.S. prescribing information, revised 06/2026 Access: Official PDF, text search | Verified | Ratio 4.75x. Trial-period proportion, not a yearly rate. Overlaps with the 75+ group; do not add. Numerators count participants with at least one qualifying fracture, not all fracture events. |
| S05-hip | GLP-1 class 133,606 adults 50-90 with type 2 diabetes (66,803 per group) Type 2 diabetes | observational Comparator: DPP-4 inhibitor | Hip or femur fracture Hazard ratio 0.7 HR 95% CI: 0.63 to 0.79 | Not available in this extraction | 3 years | Hamad CD et al. Glucagon-Like Peptide-1 Receptor Agonists and Fragility Fracture Risk in Type 2 Diabetes. JAMA Netw Open 2026;9(7):e2625141 full text; main and sensitivity analyses Access: full text; main and sensitivity analyses | Verified | No row-specific note in this extraction |
| S09-composite | tirzepatide Adults with type 2 diabetes or obesity starting tirzepatide or another GLP-1 (66,329 per matched group) Mixed (type 2 diabetes or obesity) | observational Comparator: Other GLP-1 drugs | New osteoporosis OR fragility fracture (combined) Hazard ratio 1.44 HR 95% CI: 1.22 to 1.69 | Not available in this extraction | 14 months | Hsu YH et al. Association of tirzepatide use with risk of osteoporosis compared with other GLP-1 receptor agonists. Diabetes Res Clin Pract 2025;230:112995 original publisher abstract and preview; full article not accessible Access: original publisher abstract and preview; full article not accessible | Verified | A combined outcome, not fractures alone. Not in diabetes tally (mixed population; GLP-1 comparator). Only the principal tirzepatide-versus-other-GLP-1 comparison has 66,329 per arm stated in the accessible abstract; other comparator counts not assumed. |
| S09-other-v-non | other GLP-1 drugs Adults with type 2 diabetes or obesity; nonuser comparison; matched group counts not supplied in accessible abstract Mixed (type 2 diabetes or obesity) | observational Comparator: Non-users | New osteoporosis OR fragility fracture (combined) Hazard ratio 1.07 HR 95% CI: 1.0 to 1.15 | Not available in this extraction | 14 months | Hsu YH et al. Association of tirzepatide use with risk of osteoporosis compared with other GLP-1 receptor agonists. Diabetes Res Clin Pract 2025;230:112995 original publisher abstract and preview; full article not accessible Access: original publisher abstract and preview; full article not accessible | Verified | Other GLP-1 drugs vs non-users, as reported in the abstract. Only the principal tirzepatide-versus-other-GLP-1 comparison has 66,329 per arm stated in the accessible abstract; other comparator counts not assumed. |
| S09-v-non | tirzepatide Adults with type 2 diabetes or obesity; nonuser comparison; matched group counts not supplied in accessible abstract Mixed (type 2 diabetes or obesity) | observational Comparator: Non-users | New osteoporosis OR fragility fracture (combined) Hazard ratio 1.48 HR 95% CI: 1.26 to 1.75 | Not available in this extraction | 14 months | Hsu YH et al. Association of tirzepatide use with risk of osteoporosis compared with other GLP-1 receptor agonists. Diabetes Res Clin Pract 2025;230:112995 original publisher abstract and preview; full article not accessible Access: original publisher abstract and preview; full article not accessible | Verified | Only the principal tirzepatide-versus-other-GLP-1 comparison has 66,329 per arm stated in the accessible abstract; other comparator counts not assumed. |
| Source denominator check — arithmetic checks are not replacement incidence | ||||||||
| S13-osteomalacia-count-check | GLP-1 class Adults with type 2 diabetes and obesity (73,483 per matched cohort) Type 2 diabetes | conference_or_research_brief Comparator: Matched non-users | Osteomalacia diagnosis Arithmetic check using full matched cohort denominator; not a replacement reported risk Not available in this extraction | Study group: 125 of 73,483; 1.7 per 1,000 Comparator: 49 of 73,483; 0.7 per 1,000 Difference: 1.0 per 1,000 as reported Counts and per-1,000 values are shown separately from model estimates. | 5 years | Wajahath et al. GLP-1 Receptor Agonist Use is Associated with Increased Risk of Osteoporosis, Gout, and Osteomalacia: A Retrospective Cohort Analysis original conference abstract and Table 1 (PDF visually checked); September investigator report Access: original conference abstract and Table 1 (PDF visually checked); September investigator report | verified arithmetic check of printed counts; outcome-at-risk denominator unresolved | Original abstract Table 1 event counts divided by full matched cohort sizes. Exact outcome-at-risk denominators are not supplied. Keep separate from investigator-reported percentages and RR. |
| S13-osteoporosis-count-check | GLP-1 class Adults with type 2 diabetes and obesity (73,483 per matched cohort) Type 2 diabetes | conference_or_research_brief Comparator: Matched non-users | Osteoporosis diagnosis Arithmetic check using full matched cohort denominator; not a replacement reported risk Not available in this extraction | Study group: 2,955 of 73,483; 40.2 per 1,000 Comparator: 2,284 of 73,483; 31.1 per 1,000 Difference: 9.1 per 1,000 as reported Counts and per-1,000 values are shown separately from model estimates. | 5 years | Wajahath et al. GLP-1 Receptor Agonist Use is Associated with Increased Risk of Osteoporosis, Gout, and Osteomalacia: A Retrospective Cohort Analysis original conference abstract and Table 1 (PDF visually checked); September investigator report Access: original conference abstract and Table 1 (PDF visually checked); September investigator report | verified arithmetic check of printed counts; outcome-at-risk denominator unresolved | Original abstract Table 1 event counts divided by full matched cohort sizes. Exact outcome-at-risk denominators are not supplied. Keep separate from investigator-reported percentages and RR. |
| Dated search-gap records | ||||||||
| G-orfo | orforglipron Population not stated in this extraction Diabetes status not stated | evidence_gap Comparator: Not available in this extraction | Any human bone density or fracture result Qualifying result located? none located as of 2026-09-29 95% CI not available in this extraction | Not available in this extraction | Not available in this extraction | The RX Index search of trial reports, journal indexes and U.S. labels Targeted primary-literature search and reference checks recorded in page notes; not a systematic review Access: targeted primary-source discovery and referenced-source review | dated targeted-search finding, not proof of absence | No qualifying human BMD or clinical fracture-outcome report located in targeted search through 2026-09-29; not a claim of no evidence of any kind on this drug. |
| G-recovery | all Population not stated in this extraction Diabetes status not stated | evidence_gap Comparator: Not available in this extraction | Human BMD recovery after stopping GLP-1 treatment Qualifying result located? none located as of 2026-09-29 95% CI not available in this extraction | Not available in this extraction | Not available in this extraction | The RX Index search of trial reports, journal indexes and U.S. labels Targeted primary-literature search and reference checks recorded in page notes; not a systematic review Access: targeted primary-source discovery and referenced-source review | dated targeted-search finding, not proof of absence | Human evidence gap only. Animal withdrawal studies exist and cannot settle human recovery. Search: semaglutide/tirzepatide/liraglutide/orforglipron AND bone mineral density AND withdrawal/discontinuation/recovery. |
| G-tirz-bmd | tirzepatide Population not stated in this extraction Diabetes status not stated | evidence_gap Comparator: Not available in this extraction | Randomized trial result for hip or spine BMD Qualifying result located? none located as of 2026-09-29 95% CI not available in this extraction | Not available in this extraction | Not available in this extraction | The RX Index search of trial reports, journal indexes and U.S. labels Targeted primary-literature search and reference checks recorded in page notes; not a systematic review Access: targeted primary-source discovery and referenced-source review | dated targeted-search finding, not proof of absence | No qualifying randomized human hip/spine BMD result located. Mixed-drug observational DXA evidence exists (Liu) and does not estimate tirzepatide separately. |
Source: The RX Index GLP-1 Bone Evidence Map v1.1, checked September 29, 2026. The complete dataset is available as the CSV above.
Frequently asked questions
Does Ozempic affect bone density? Yes, in one trial of people at increased fracture risk. Semaglutide 1.0 mg, a dose used by Ozempic, left hip BMD 2.59% lower and spine BMD 2.05% lower relative to placebo after 52 weeks in 64 adults without diabetes (Hansen et al., 2024). The trial was not designed to estimate fracture risk; the reviewed Ozempic label has no clinical fracture statement.
Can bone loss from Ozempic be reversed? No qualifying human study was located in this targeted review that shows whether BMD returns after stopping a GLP-1 (checked September 29, 2026). The 2024 semaglutide trial’s authors said their design could not test recovery (Hansen et al.). Ask your prescriber whether a bone density scan makes sense for you.
Does Wegovy increase fracture risk? SELECT reported similar fracture adverse-event proportions overall: 3.5% on semaglutide vs 3.6% on placebo. But not all nonserious fractures were systematically collected, and hip/pelvis proportions were higher at age 75+ (24.2 vs 6.0 per 1,000) and in women (9.8 vs 2.1 per 1,000) over the trial. The Wegovy label lists those counts; they are not annual rates or proof of a drug-caused increase.
Does tirzepatide (Zepbound or Mounjaro) cause bone loss? This map does not establish a drug-specific BMD effect. We found no randomized human trial reporting tirzepatide’s effect on hip or spine bone density, and a 2026 pooled analysis says its phase 3 trials didn't assess it (Alfaris et al., 2026). Health-record studies point both ways depending on the comparison.
Is tirzepatide worse for bones than semaglutide? The studies in this map don't show that. One linked tirzepatide to a 44% higher hazard of a combined “osteoporosis or fracture” outcome than other GLP-1s (Hsu et al., 2025), while another found both drugs linked to fewer femoral fractures than DPP-4 inhibitors in people 65+ with diabetes. Neither is a head-to-head trial.
Is it the drug or the weight loss? Weight loss may explain part of it, but the studies here do not isolate one cause. Liu linked greater weight loss with greater hip BMD decline; the diet trial also found BMD loss, but it was not matched head to head with semaglutide. Hamad’s diabetes analysis retained a lower fracture-hazard estimate after modelling weight and blood-sugar changes (Liu, Villareal, Hamad).
Does exercise stop GLP-1 bone loss? It has not been shown to stop every loss of bone density. In a 195-person trial, liraglutide plus exercise had no clear hip/spine BMD difference from placebo, but hip BMD still fell within the combination group. No fragility fractures were reported in any group; the trial was not powered to establish fracture prevention (Jensen et al., 2024).
Should I stop my GLP-1 because of my bones? These studies can't answer that for you. The right choice depends on your bone health, your other conditions and what the drug is doing for you. Bring the numbers on this page to your prescriber.
Sources
All checked September 29, 2026.
- S01 Hansen MS, Wölfel EM, Jeromdesella S, et al. Once-weekly semaglutide versus placebo in adults with increased fracture risk: a randomised, double-blinded, two-centre, phase 2 trial. eClinicalMedicine. 2024;72:102624. https://pmc.ncbi.nlm.nih.gov/articles/PMC11087719/
- S02 Jensen SBK, Sørensen V, Sandsdal RM, et al. Bone Health After Exercise Alone, GLP-1 Receptor Agonist Treatment, or Combination Treatment: A Secondary Analysis of a Randomized Clinical Trial. JAMA Network Open. 2024;7(6):e2416775. https://jamanetwork.com/journals/jamanetworkopen/fullarticle/2820308
- S03 Novo Nordisk. Wegovy (semaglutide) U.S. prescribing information, revised 06/2026. https://www.novo-pi.com/wegovy.pdf
- S04 Kushner RF, Ryan DH, Deanfield J, et al. Safety profile of semaglutide versus placebo in the SELECT study: a randomized controlled trial. Obesity. 2025;33(3):452–462. https://pmc.ncbi.nlm.nih.gov/articles/PMC11897845/
- S05 Hamad CD, Wiener J, Golzar A, et al. Glucagon-Like Peptide-1 Receptor Agonists and Fragility Fracture Risk in Type 2 Diabetes. JAMA Network Open. 2026;9(7):e2625141. https://jamanetwork.com/journals/jamanetworkopen/fullarticle/2852068
- S06 Huang YN, Tsou MY, Li PH, et al. Associations of Semaglutide With Skeletal Outcomes in People With Obesity, With and Without Type 2 Diabetes: A Target Trial Emulation. Diabetes, Obesity and Metabolism. 2026;28(7):5834–5847. https://dom-pubs.onlinelibrary.wiley.com/doi/full/10.1111/dom.70786
- S07 Chen HY, Wu JY, Chu YH, Chen TW, Huang CF. Lower fall and femoral fracture risks with semaglutide and tirzepatide compared with DPP-4 inhibitors in older adults with type 2 diabetes. Osteoporosis International. Published July 11, 2026. https://link.springer.com/article/10.1007/s00198-026-08134-y
- S08 Kasher Meron M, Hornik-Lurie T, Twig G, Rotman-Pikielny P. GLP-1 receptor agonists and the risk of fragility fractures in older adults with type 2 diabetes. Journal of Clinical Endocrinology & Metabolism. 2026;111(7):1949–1958. https://pubmed.ncbi.nlm.nih.gov/41665888/
- S09 Hsu YH, Liang YC, Chan KC, et al. Association of tirzepatide use with risk of osteoporosis compared with other GLP-1 receptor agonists: A retrospective cohort study using the TriNetX database. Diabetes Research and Clinical Practice. 2025;230:112995. https://www.sciencedirect.com/science/article/abs/pii/S0168822725010101
- S10 Liu Y, Walzer D, Schmitz S, et al. Skeletal effect of semaglutide and tirzepatide in patients with increased risk of fractures. Journal of Clinical Endocrinology & Metabolism. 2026;111(7):1959–1966. https://academic.oup.com/jcem/article-abstract/111/7/1959/8467122
- S11 Epic Research. GLP-1 Use Associated with Lower Osteoporosis Risk in Adults with Type 2 Diabetes but Higher Risk in Adults Without Diabetes. March 3, 2026. https://www.epicresearch.org/articles/glp-1-use-associated-with-lower-osteoporosis-risk-in-adults-with-type-2-diabetes-but-higher-risk-in-adults-without-diabetes/
- S12 Constantine E, Enthoven L, Kahan R, Pflug E, Lauder A. The Impact of Glucagon-Like Peptide-1 Receptor Agonists on Fracture Risk in Overweight or Obese, Nondiabetic Patients. Journal of the American Academy of Orthopaedic Surgeons. 2026;34(12):e1610–e1619. https://doi.org/10.5435/JAAOS-D-24-01505
- S13 Wajahath M, Lawand JJ, Hill BW, Khan A, Abboud JA, Horneff JG. AAOS 2026 conference abstract and Table 1, submission 008736. https://submissions.mirasmart.com/Verify/AAOS2026/Submission/out/AAOS2026-008736.PDF. Investigator report: Lawand J, Abboud J. New studies link GLP-1 receptor agonist medications to tendon rupture risk and changes in bone metabolism. AAOS Now. September 18, 2026. https://www.aaos.org/aaosnow/2026/sep/research/research01/
- S14 Cheng L, Hu Y, Li YY, et al. Glucagon-like peptide-1 receptor agonists and risk of bone fracture in patients with type 2 diabetes: A meta-analysis of randomized controlled trials. Diabetes/Metabolism Research and Reviews. 2019;35(7):e3168. https://doi.org/10.1002/dmrr.3168
- S15 Alfaris N, Kushner RF, Li J, et al. Tirzepatide for Obesity in Adults ≥65 Years: A Post Hoc Analysis of the SURMOUNT and SUMMIT Clinical Trials. Diabetes, Obesity and Metabolism. 2026;28(9):8072–8083. https://pmc.ncbi.nlm.nih.gov/articles/PMC13449079/
- S16 Novo Nordisk. Ozempic (semaglutide) U.S. prescribing information, revised 05/2026. https://www.novo-pi.com/ozempic.pdf
- S17 Eli Lilly. Mounjaro (tirzepatide) U.S. prescribing information, revised 08/2026. https://dailymed.nlm.nih.gov/dailymed/drugInfo.cfm?setid=d2d7da5d-ad07-4228-955f-cf7e355c8cc0
- S18 Eli Lilly. Zepbound (tirzepatide) U.S. prescribing information, revised 08/2026. https://pi.lilly.com/us/zepbound-uspi.pdf
- S19 Novo Nordisk. Saxenda (liraglutide) U.S. prescribing information, revised 02/2026. https://www.accessdata.fda.gov/drugsatfda_docs/label/2026/206321s025lbl.pdf
- S20 Eli Lilly. Foundayo (orforglipron) U.S. prescribing information, revised 04/2026. https://www.accessdata.fda.gov/drugsatfda_docs/label/2026/220934Orig1s000lbl.pdf
- S21 Iepsen EW, Lundgren JR, Hartmann B, et al. GLP-1 Receptor Agonist Treatment Increases Bone Formation and Prevents Bone Loss in Weight-Reduced Obese Women. Journal of Clinical Endocrinology & Metabolism. 2015;100(8):2909–2917. DOI: 10.1210/jc.2015-1176. Original abstract in the authors’ institutional repository: https://research.regionh.dk/en/publications/glp-1-receptor-agonist-treatment-increases-bone-formation-and-pre/
- S22 Villareal DT, Fontana L, Weiss EP, et al. Bone mineral density response to caloric restriction-induced weight loss or exercise-induced weight loss: a randomized controlled trial. Archives of Internal Medicine. 2006;166(22):2502–2510. https://pubmed.ncbi.nlm.nih.gov/17159017/. Diet context, not a GLP-1 study.
The RX Index Research is the research and reference section of therxindex.com.