GLP-1 Clinical Trial Guide
Placebo-Adjusted Weight Loss Explained: How to Read GLP-1 Trial Results
Published: · Last reviewed:
Last verified:
You probably landed on this page because you saw two different weight-loss numbers for the same drug and wanted to know which one was real. Wegovy at 14.9% in one place. Wegovy at 12.4% “placebo-adjusted” somewhere else. Same trial. Same patients. Two numbers.
Both are correct. Here’s the bottom line.
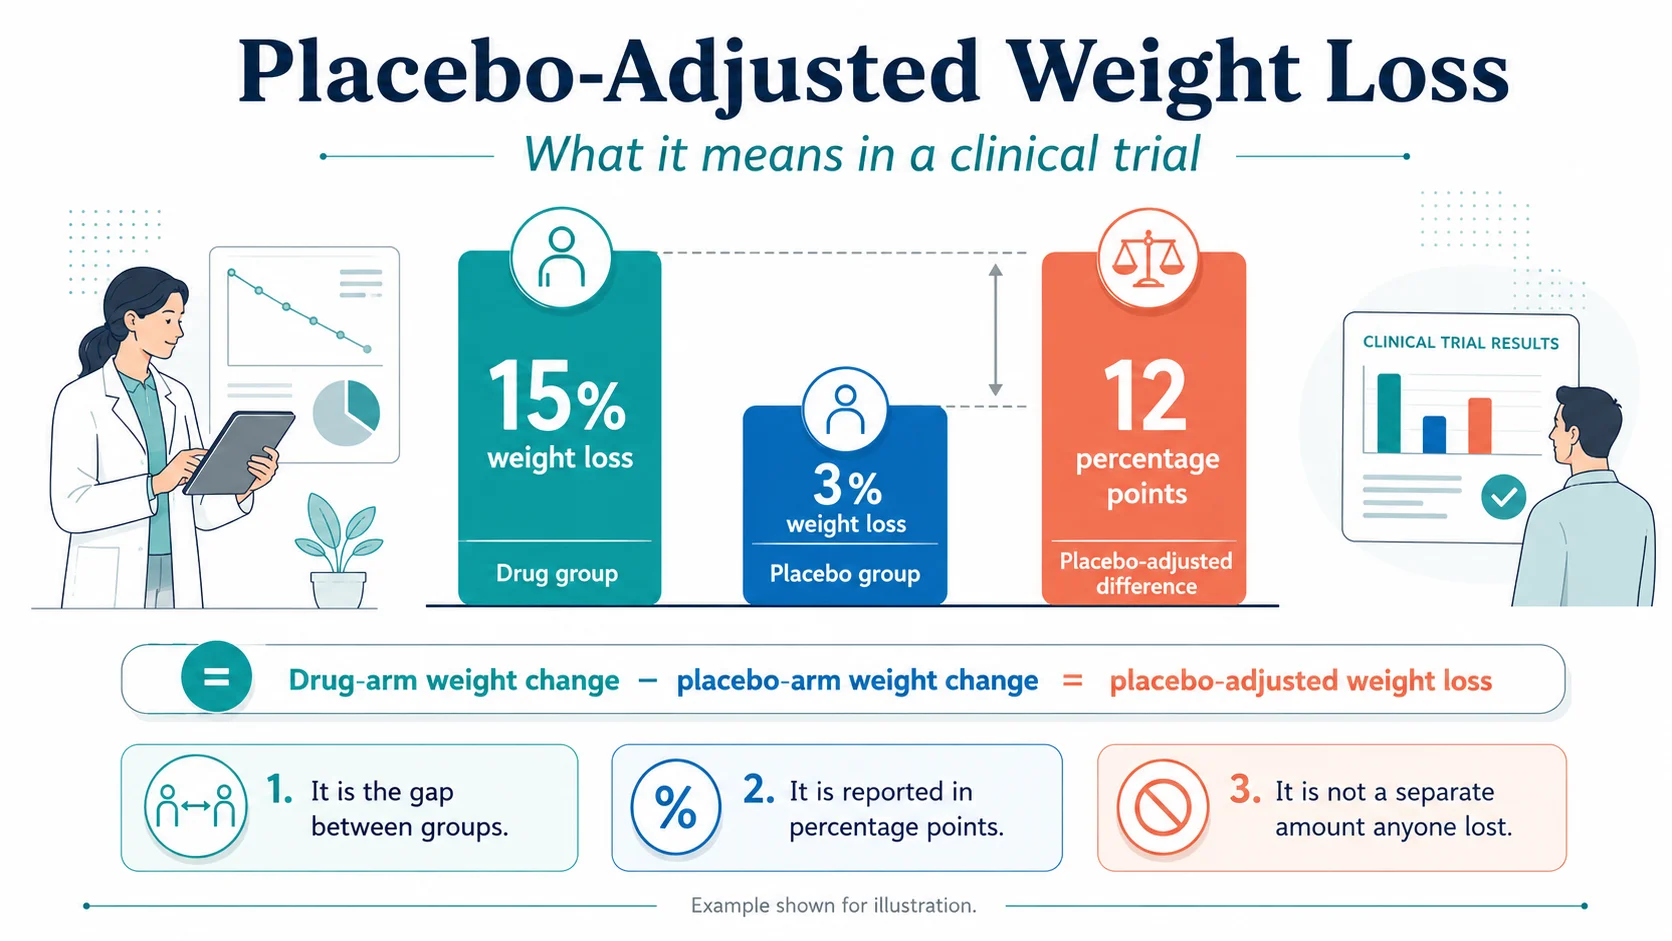
Placebo-adjusted weight loss is the difference between the average weight loss in the drug group and the average weight loss in the placebo group of a clinical trial. In the Wegovy STEP 1 trial, the drug arm lost 14.9% of body weight at week 68. The placebo arm lost 2.4%. The placebo-adjusted treatment difference listed on the FDA label is −12.4 percentage points. It is the size of the gap between the two groups, not a separate weight loss anyone actually had.
The placebo group did not “do nothing.” They got the same lifestyle counseling, the same study visits, and the same monthly weigh-ins as the drug group. That is why they lost weight at all — and why the placebo-adjusted number is the one regulators care about, but also why it is not the number you will likely match in real life.
By the end of this guide you will know exactly what the term means, why the same drug has two or three different “correct” numbers in the same trial, what the placebo-adjusted number is for every FDA-approved GLP-1 weight-loss medication available right now, and which number actually matters for your decision.
What Placebo-Adjusted Weight Loss Actually Means
Quick answer
The formula is simple:
There is no hidden math. No statistical sleight of hand. It is straight subtraction, with one small wrinkle: regulators use a model-adjusted version called a least-squares mean, which can shift the number by 0.1 or 0.2 percentage points.
You will also see this concept written three other ways. In GLP-1 weight-loss trial reporting, these terms usually point to the same between-group idea:
- Placebo-subtracted weight loss
- Placebo-corrected weight loss
- Estimated treatment difference versus placebo
We will use “placebo-adjusted” throughout.
Why does this number exist at all? Because in any modern obesity trial, both arms lose weight. The placebo arm loses weight from the lifestyle program, the trial environment, and the basic act of being watched. Reporting only the drug arm’s number would credit the molecule for everything that happened to those patients — including the parts that had nothing to do with the drug. The placebo-adjusted number isolates the part that is fairly attributable to the medication itself.
Percentage Points vs Percent: The Most Common Mistake
Quick answer
“12 percentage points” is a flat subtraction of two percentages: 15 minus 3. “12% more” is a relative comparison — it would mean the drug arm lost 12% more of what the placebo arm lost, which would be 3.36% body weight. Off by a factor of about four.
When you see a press release that says “Drug X produced 17.8% greater weight loss than placebo,” squint. Almost always, what they mean is 17.8 percentage points of difference — the gap between roughly 21% and 3% in SURMOUNT-1. If a writer actually meant “17.8% more than placebo’s 3%,” the result would be 3.5%, which is not a story anyone would publish.
We use percentage points throughout this guide. When you see “pp” after a number, that is shorthand for percentage points.
Worked Example: Wegovy (Semaglutide 2.4 mg)
Quick answer
The math:
The label rounds slightly differently to −12.4 because the FDA reports a least-squares mean — a model-adjusted average that accounts for missing data and trial structure. This is normal. The underlying meaning is the same: the drug arm lost about 12 to 13 percentage points more body weight than the placebo arm over 68 weeks. (Source: Wegovy prescribing information; Wilding et al., NEJM 2021.)
For someone who started the trial at 232 pounds (the trial’s average baseline), 14.9% works out to roughly 35 pounds lost. The placebo arm averaged about 6 pounds lost. The drug-attributable portion is the 29-pound gap between them.
You can read the placebo-adjusted number as “the part of the weight loss that the drug appears to be doing on top of everything else.” The 6 pounds the placebo arm lost are real pounds — they did not magically come back. But they were not pounds the drug caused.
Worked Example: Zepbound (Tirzepatide)
Quick answer
| Trial arm | Avg body-weight change | Placebo-adjusted difference |
|---|---|---|
| Placebo | −3.1% | reference |
| Zepbound 5 mg | −15.0% | −11.9 pp |
| Zepbound 10 mg | −19.5% | −16.4 pp |
| Zepbound 15 mg | −20.9% | −17.8 pp |
For a participant at the trial’s average baseline weight of about 231 pounds, those percentages translate to roughly 35, 45, and 48 pounds lost on the three doses. The placebo arm averaged about 7 pounds lost.
The dose-response is real. Higher tirzepatide doses produced bigger losses both in absolute terms and relative to placebo — the kind of internal consistency clinicians and regulators look for as a signal that the molecule is doing real work.
Full Comparison Table: Every FDA-Approved GLP-1 for Weight Loss
All numbers from current FDA prescribing information or the named peer-reviewed phase 3 publication. Numbers checked May 6, 2026. “pp” = percentage points.
| Drug (dose) | Trial | Duration | Drug arm | Placebo arm | Placebo-adjusted |
|---|---|---|---|---|---|
| Wegovy 2.4 mg (semaglutide) | STEP 1 | 68 wk | −14.9% | −2.4% | −12.4 pp |
| Wegovy 7.2 mg (semaglutide HD) | STEP UP | 72 wk | −18.8% | −3.9% | −14.9 pp |
| Zepbound 5 mg (tirzepatide) | SURMOUNT-1 | 72 wk | −15.0% | −3.1% | −11.9 pp |
| Zepbound 10 mg (tirzepatide) | SURMOUNT-1 | 72 wk | −19.5% | −3.1% | −16.4 pp |
| Zepbound 15 mg (tirzepatide) | SURMOUNT-1 | 72 wk | −20.9% | −3.1% | −17.8 pp |
| Foundayo 5.5 mg (orforglipron) | ATTAIN-1 | 72 wk | −7.4% | −2.1% | −5.3 pp |
| Foundayo 9 mg (orforglipron) | ATTAIN-1 | 72 wk | −8.3% | −2.1% | −6.2 pp |
| Foundayo 17.2 mg (orforglipron) | ATTAIN-1 | 72 wk | −11.1% | −2.1% | −9.0 pp |
| Saxenda 3.0 mg (liraglutide) | SCALE | 56 wk | −8.4% | −2.8% | −5.4 pp |
Interested in Foundayo specifically? See Foundayo availability, cost, and access options for 2026.
Why the Placebo Group Lost Weight in the First Place
Quick answer
This is the section that most coverage of placebo-adjusted weight loss skips. But the formula only makes sense if you understand what the placebo arm actually went through.
Embedded lifestyle counseling
The Zepbound prescribing information states that participants in both arms of SURMOUNT-1 received instruction on a reduced-calorie diet (a deficit of about 500 kcal/day) and at least 150 minutes per week of physical activity. The same is true in STEP 1 for semaglutide and SCALE for liraglutide. Every “placebo” participant in modern obesity drug trials is enrolled in what is essentially a structured weight-loss program. The pill is the only inert thing about the experience.
The placebo response
A 2022 Lancet eClinicalMedicine meta-analysis of 19,048 placebo-arm participants in obesity trials found a pooled mean weight reduction of 1.4 kg and a BMI reduction of 1.0 kg/m². In obesity drug trials, this includes expectation, lifestyle counseling, observation, regression to the mean, and other trial effects rolled together.
The Hawthorne effect
People change their behavior because they know they are being observed. A 2014 PLOS One study tracking obese adults in a sleep-extension trial found measurable biochemical and behavioral changes between screening and randomization — before any intervention had begun. The act of being in a study moved their numbers.
Regression to the mean
Trial participants enroll at high-weight moments in their lives. People do not usually sign up for an obesity drug trial when their weight is at a personal low. Statistical drift back toward each individual’s personal mean alone produces measurable weight loss across the group.
Run-in period selection
Some trials select for motivated responders before randomization. SURMOUNT-3 is the cleanest example. Participants had to lose at least 5% of body weight during a 12-week intensive lifestyle intervention before they were randomized to tirzepatide or placebo. The placebo arm in that trial — selected from people who had just demonstrated they could lose weight on lifestyle change alone — actually gained 2.5% over the next 72 weeks. The treatment effect of tirzepatide on top of an already-motivated population was −20.8 percentage points.
Research participation effect
Frequent visits, regular labs, and direct contact with study staff change patient behavior in ways that are independent of the placebo effect. Patients in trials adhere to lifestyle change more than patients in real-world clinical care because the structure of the trial pulls them along.
The takeaway: when you see a placebo arm lose 2.4% over 68 weeks, you are looking at the integrated output of those six forces. None of them is the drug. All of them are real. Once you understand them, the placebo-adjusted number becomes much easier to interpret correctly.
Placebo-Adjusted Weight Loss vs the Placebo Effect
Quick answer
This trips up almost every news reader. When a headline says “Wegovy was 12.4% placebo-adjusted,” it does not mean “12.4% of the weight loss came from the placebo effect.” It means “the difference between the two arms was 12.4 percentage points.” The placebo arm’s 2.4% loss includes a small psychological placebo effect, but it also includes real lifestyle change, real behavior shifts, and real attention from clinical staff.
The cleaner way to say it: the placebo-adjusted number is the difference between the two randomized groups. Whatever was happening in the placebo group — drug-related or not — gets subtracted out.
Why the Same Drug Has Two or Three Different “Correct” Numbers: Estimands Explained
Quick answer
Here is what this looks like in practice. SURMOUNT-1 reported two primary numbers for tirzepatide 15 mg at 72 weeks:
- Treatment-regimen estimand: −20.9% body weight loss — includes everyone who was randomized, regardless of whether they stayed on the drug.
- Efficacy estimand: −22.5% body weight loss — includes only people who actually took the drug as prescribed and excludes data points after they stopped.
Same drug. Same trial. Same time point. A 1.6-point gap between two numbers, both of which are correct.
The treatment-regimen estimand answers: What happens on average to people randomized to this drug, across the messy reality of treatment? The efficacy estimand answers: What happens to people who actually take this drug as designed?
The FDA’s E9(R1) guidance, finalized in 2021, gives sponsors a structured framework for defining the treatment effect a trial is designed to estimate — including how intercurrent events like discontinuation are handled — so readers can tell which question the reported number is answering. This is one of the cleanest improvements in obesity-drug reporting of the last decade, and almost no consumer coverage explains it.
For SURMOUNT-5 — the only head-to-head trial of Wegovy vs Zepbound — tirzepatide at maximum tolerated dose produced −20.2% versus semaglutide at −13.7% at 72 weeks. That 6.5 percentage point gap is the most reliable direct comparison available.
Why Maintenance Trials Show Even Bigger Placebo-Adjusted Gaps
Quick answer
The Zepbound SURMOUNT-4 maintenance trial is the cleanest example. Participants who had already lost weight on tirzepatide were randomized to continue or switch to placebo. Those who switched to placebo regained weight rapidly over the next 52 weeks, while those who continued on tirzepatide maintained their loss. The resulting placebo-adjusted gap was dramatically larger than in a standard initiation trial — not because the drug got more effective, but because the placebo arm’s condition changed.
This is why you cannot simply compare placebo-adjusted numbers across different trial types. An initiation trial and a maintenance trial answer completely different questions.
A 2025 JAMA Internal Medicine post-hoc analysis of SURMOUNT-4 found that the cardiometabolic improvements achieved during the active-treatment phase reversed as weight was regained after stopping tirzepatide — reinforcing that the placebo-adjusted gap in a maintenance trial reflects the sustained benefit of continued treatment.
Red Flags When You See a Placebo-Adjusted Claim Online
Quick answer
Missing raw numbers
A piece quotes the placebo-adjusted number but never gives you the drug arm or placebo arm raw numbers. You cannot verify the math. You are being asked to trust the abstract.
Cross-trial comparison as if head-to-head
A piece compares two drugs from different trials as if the comparison were head-to-head. Population and protocol differences are doing more work than the molecules.
“12% more weight loss” instead of “12 percentage points”
The reader cannot tell whether this is a relative or absolute claim. The numbers imply very different outcomes.
Diabetes status omitted
People with type 2 diabetes generally lose less weight in the major GLP-1 obesity trials, and placebo-adjusted gaps can be much smaller. Mixing the two populations distorts the comparison.
Press release as the source
Press releases are written by communications teams. Labels are reviewed by regulators. Trial publications are reviewed by other scientists. The hierarchy matters.
How to Read a GLP-1 Weight-Loss Trial Table
Quick answer
Here is the decoder for the labels you will see:
| Term in the table | What it actually means |
|---|---|
| Baseline mean weight | Average starting weight in pounds or kilograms |
| % change from baseline | Average weight change from start, expressed as a percentage |
| LSMean (least-squares mean) | Model-adjusted average that accounts for missing data and design |
| Estimated treatment difference | Placebo-adjusted result — the LSMean of the drug arm minus the LSMean of the placebo arm |
| 95% CI | The range the true difference probably falls within, with 95% confidence |
| ITT (intention-to-treat) | Analysis includes everyone randomized, regardless of whether they completed |
| Treatment-regimen estimand | Real-world-style analysis: what happened to randomized patients, including those who stopped |
| Trial-product / efficacy estimand | What happened to patients while they were actually on the drug |
| Retrieved dropout | Patients who discontinued but agreed to keep being measured |
| Imputation | Statistical filling-in of missing data based on a stated assumption |
| Intercurrent event | Something after randomization that affects interpretation — e.g. discontinuation or rescue therapy |
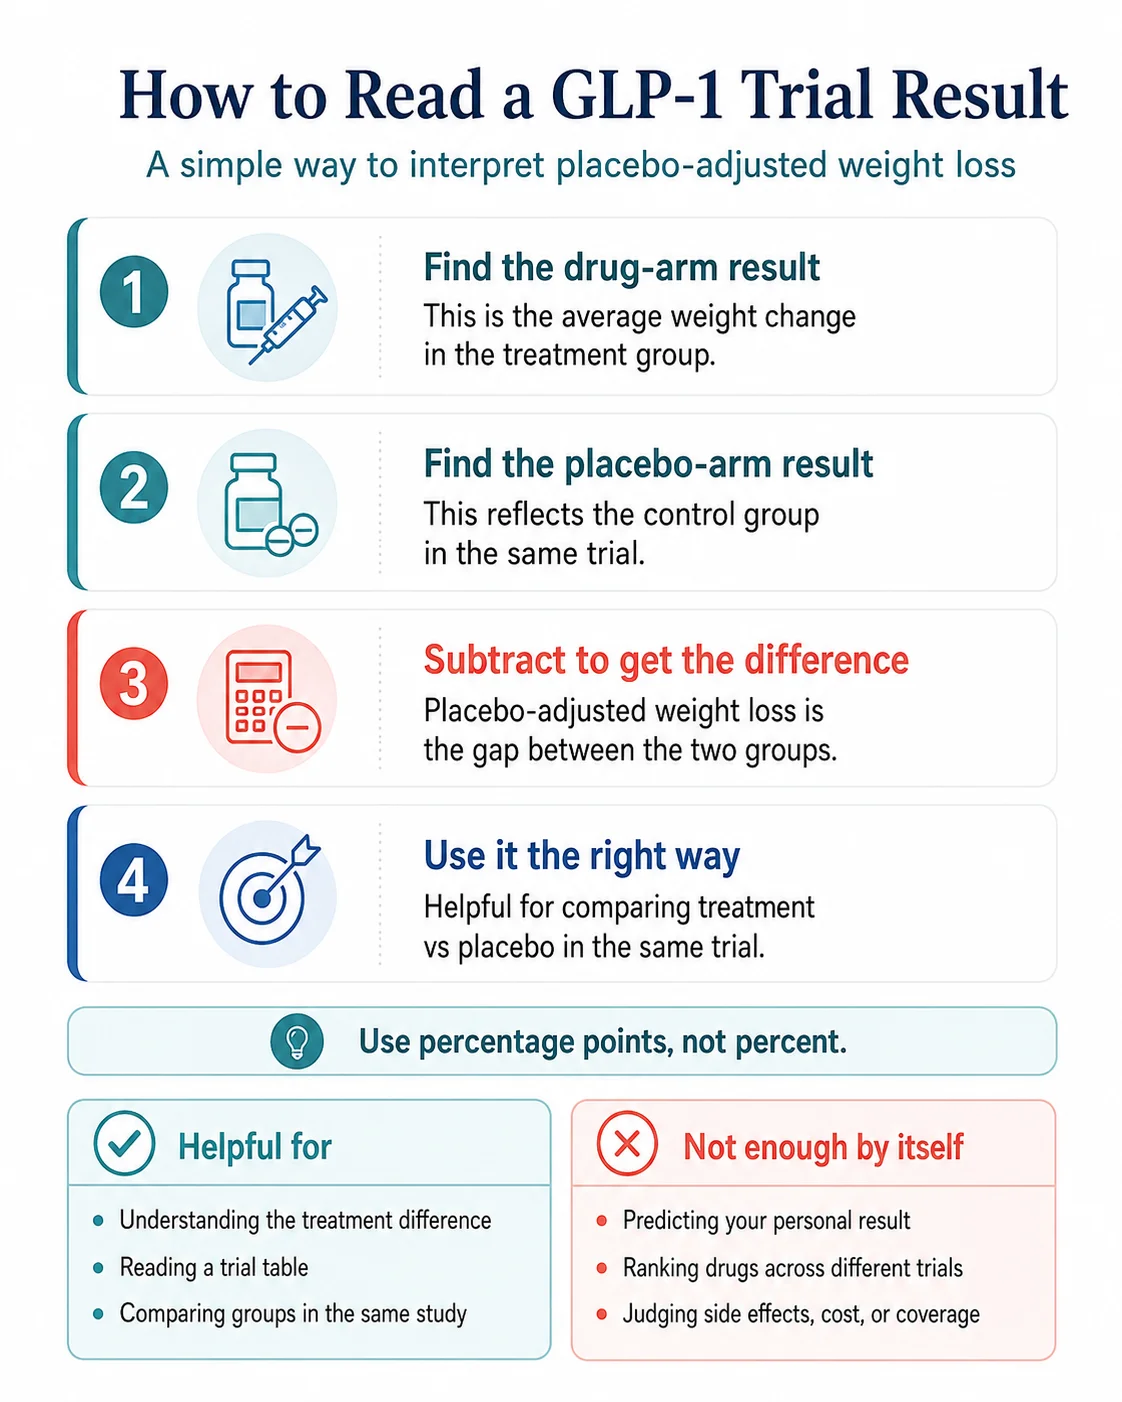
Here is the order to read a trial table:
- Who was in the trial? Diabetes or no diabetes? Mean baseline BMI? Read the population paragraph before any number.
- What was the duration? A 12-week result is not comparable to a 72-week result. Long trials often show plateaus; short trials catch the steep part of the loss curve.
- Find the drug arm’s mean weight change.
- Find the placebo arm’s mean weight change.
- Find the estimated treatment difference. If it is not given directly, subtract the two means yourself. If your subtraction doesn’t match exactly, you are looking at LSMean adjustment — normal.
- Find the responder rates: ≥5%, ≥10%, ≥15%, ≥20%. These tell you how variation distributes around the mean.
- Find the discontinuation and adverse event rates. Efficacy without tolerability is not useful information.
After that, you can compare. Not before.
A Quick Calculator: Doing the Math Yourself
Quick answer
If the drug group lost 14.9% and the placebo group lost 2.4%:
To translate to pounds, multiply each percentage by the trial’s baseline weight. For a 232-pound average:
Drug arm: 232 × 0.149 = 34.6 pounds
Placebo arm: 232 × 0.024 = 5.6 pounds
Drug-attributable difference: about 29 pounds
Two caveats:
- Your subtraction may not match the printed label exactly because regulators report least-squares means. The difference is usually 0.1 to 0.3 percentage points.
- The trial average is a population average. Your individual result could be substantially higher or lower.
Glossary
Each term is defined for interpreting GLP-1 obesity trial tables.
- Active treatment group
- Participants randomized to receive the experimental drug.
- Baseline
- Starting condition measured before any treatment begins.
- Confidence interval (CI)
- The range within which the true value of a measurement probably falls. A 95% CI of −13.5 to −11.3 means the true treatment effect is highly likely to be somewhere in that range.
- Discontinuation rate
- The percentage of trial participants who stopped the study drug before the trial ended.
- Efficacy estimand (trial-product estimand)
- A trial analysis that measures what happens to participants while they are actually taking the drug as prescribed.
- Estimand
- A precise definition of the treatment effect a trial is designed to estimate. Different estimands answer different questions and can produce different correct numbers from the same data.
- Hawthorne effect
- Behavior change that happens because participants know they are being observed.
- Intention-to-treat (ITT)
- An analysis that includes all randomized participants regardless of whether they completed the trial.
- Intercurrent event
- Something that happens after randomization that affects how the trial outcome should be interpreted — typically discontinuation, rescue medication, or noncompliance.
- Least-squares mean (LSMean)
- A statistical average adjusted for missing data and trial covariates, used in regulatory reporting instead of raw arithmetic means.
- Percentage point
- A flat subtraction of two percentages. Distinct from “percent,” which can imply a relative comparison.
- Placebo-adjusted weight loss
- The difference between average weight loss in the drug arm and average weight loss in the placebo arm.
- Placebo effect
- The specific psychological and physiological response driven by the expectation of receiving an active treatment. One of several contributors to placebo-arm outcomes, not the only one.
- Randomized controlled trial (RCT)
- A study in which participants are assigned by chance to receive the active treatment or a placebo, allowing fair comparison.
- Regression to the mean
- The statistical tendency for extreme measurements to drift back toward an individual's typical value over time.
- Responder threshold
- A weight-loss target used to categorize participants — typically ≥5%, ≥10%, ≥15%, or ≥20% of baseline body weight.
- Run-in period
- A pre-randomization period that may select for motivated participants or stable responders before the actual trial begins.
- Treatment-regimen estimand (treatment policy estimand)
- A trial analysis that measures what happens to all randomized participants regardless of whether they stayed on the drug. Generally the more conservative, real-world-aligned estimate.
Frequently Asked Questions
What does placebo-adjusted weight loss mean?
How do you calculate placebo-adjusted weight loss?
Is placebo-adjusted weight loss what I should expect to lose?
Why did the placebo group lose weight in the Wegovy and Zepbound trials?
Is placebo-adjusted the same as the placebo effect?
What is the placebo-adjusted weight loss for Wegovy?
What is the placebo-adjusted weight loss for Zepbound?
What is the placebo-adjusted weight loss for Foundayo (orforglipron)?
Can I compare Wegovy and Zepbound using placebo-adjusted weight loss?
Why do trial numbers sometimes differ between articles, the FDA label, and the press release?
What is an estimand?
Does placebo-adjusted weight loss include side effects?
Why are weight-loss percentages shown as negative numbers in trial tables?
Sources
This page draws from primary regulatory and peer-reviewed sources. Numbers checked .
- 1. Wegovy (semaglutide) prescribing information. Novo Nordisk, current label including 1.7 mg, 2.4 mg, and 7.2 mg injection and 25 mg tablet formulations.
- 2. Zepbound (tirzepatide) prescribing information. Eli Lilly, 2026 revision.
- 3. Saxenda (liraglutide 3.0 mg) prescribing information. Novo Nordisk.
- 4. Foundayo (orforglipron) prescribing information. Eli Lilly, FDA approval April 1, 2026.
- 5. Wilding JPH et al. Once-Weekly Semaglutide in Adults with Overweight or Obesity (STEP 1). New England Journal of Medicine. 2021.
- 6. Garvey WT et al. Two-year effects of semaglutide in adults with overweight or obesity: the STEP 5 trial. Nature Medicine. 2022.
- 7. Once-weekly semaglutide 7.2 mg in adults with obesity (STEP UP): a randomised, controlled, phase 3b trial. The Lancet Diabetes & Endocrinology. 2025.
- 8. Jastreboff AM et al. Tirzepatide Once Weekly for the Treatment of Obesity (SURMOUNT-1). New England Journal of Medicine. 2022.
- 9. Wadden TA et al. Tirzepatide after intensive lifestyle intervention in adults with overweight or obesity: the SURMOUNT-3 phase 3 trial. Nature Medicine. 2023.
- 10. Aronne LJ et al. Continued Treatment With Tirzepatide for Maintenance of Weight Reduction in Adults With Obesity: The SURMOUNT-4 Randomized Clinical Trial. JAMA. 2024.
- 11. Cardiometabolic Parameter Change by Weight Regain on Tirzepatide Withdrawal in Adults With Obesity: A Post Hoc Analysis of the SURMOUNT-4 Trial. JAMA Internal Medicine. 2025.
- 12. Aronne LJ et al. Tirzepatide as Compared with Semaglutide for the Treatment of Obesity (SURMOUNT-5). New England Journal of Medicine. 2025.
- 13. ATTAIN-1: Phase 3 trial of orforglipron in adults with obesity. New England Journal of Medicine. 2025.
- 14. Pi-Sunyer X et al. A Randomized, Controlled Trial of 3.0 mg of Liraglutide in Weight Management (SCALE Obesity and Prediabetes). New England Journal of Medicine. 2015.
- 15. Chin SO et al. The placebo response rate and nocebo events in obesity pharmacological trials. A systematic review and meta-analysis. eClinicalMedicine (The Lancet). 2022.
- 16. Garvey WT, Mechanick JI et al. Estimating and reporting treatment effects in clinical trials for weight management: using estimands to interpret effects of intercurrent events and missing data. International Journal of Obesity. 2021.
- 17. FDA Guidance for Industry. E9(R1) Statistical Principles for Clinical Trials: Addendum: Estimands and Sensitivity Analysis in Clinical Trials. 2021.
- 18. Cizza G et al. Hawthorne effect with transient behavioral and biochemical changes in a randomized controlled sleep extension trial of chronically short-sleeping obese adults. PLOS One. 2014.
- 19. Effect of glucagon-like peptide-1 receptor agonists and co-agonists on body composition: Systematic review and network meta-analysis (22 RCTs). 2025.
The RX Index publishes educational and comparison content on GLP-1 medications and may earn revenue from some provider or program pages elsewhere on the site. This explainer is informational, does not rank or recommend medications, and its trial numbers are sourced from prescribing information and peer-reviewed publications.
This page explains clinical-trial terminology. It is not medical advice. Talk to a qualified healthcare provider for guidance specific to your situation.
Last verified: .